
Note: this paper will be published in Skeptic Magazine in March, 2017
In case you are not familiar with how college football determines the four teams that are picked to contend for the national championship, I refer you to the Selection Committee Protocol which is a guide on how the committee chooses the four playoff teams at the end of the regular season and after the league championship games. The first words of the protocol are telling: “Ranking football teams is an art, not a science.” The protocol specifically calls into question any rigorous mathematical approach: “Nuanced mathematical formulas ignore some teams who “deserve” to be selected.” For those that are not aficionados of the college football selection, the previous selection process used computer polls as one third of the formula to determine the final two teams (before the four-team process was initiated in 2014 – the other two thirds of the formula came from the Associated Press and Harris polls). What I hope to show in this essay is that 1) humans are primed with natural biases (whether they realize it or not) and therefore, are not effective at simultaneously considering the huge amounts of data available and 2) computer algorithms are spectacularly successful at analyzing massive data bases, sometimes called “deep data”, to ascertain the best choices for the playoff system.
So what are the guidelines that instruct the 13 member college playoff panel? They are somewhat obvious and include “conference championship wins, strength of schedule, head-to-head competition, comparative outcomes of common opponents, and other relevant factors such as key injuries that may have affected a team’s performance during the season or likely will affect its postseason performance.” I hasten to point out that strength of schedule can only be determined by “nuanced mathematical” rigor. The guidelines fall into two categories: facts (e.g., conference champions) and opinions (e.g., whether a key injury will impact team performance). My argument is to eliminate opinions and choose the final 4 teams in the most rational and unbiased fashion — that is, use computer algorithms. Exceptions to the computer rankings could be made by the committee when facts like conference championships play an important role. For example, if Notre Dame and Florida State University each had one loss at the end of the season but the computer rankings had Notre Dame above FSU, the committee might override the computer rankings and choose FSU over ND if FSU won the Atlantic Coast Conference championship (ND is not in a conference and therefore cannot win conference championships). Let me spend some time justifying my proposed selection process.
I have created a table below which shows the top 15 teams in the final polls of the 2015 season along with their won-loss records for reference purposes. The first two polls are the AP and Coaches polls and the final two are the Sagarin and Colley computer polls. Keeping in mind that the computer algorithms that determine the computer polls have no human intervention (the data on wins and score differentials are simply entered into the matrices), it is remarkable that the computer polls agree so closely with the human polls particularly within the top 5 teams (remember there are 128 teams in the NCAA Division I Football Bowl Subdivision – FBS in 2015). The details of the computer algorithms are discussed at the end of the essay.
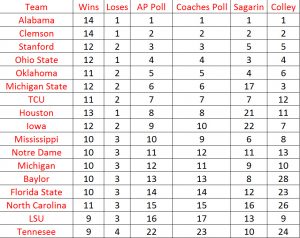 Rankings from the final week of the 2015 season.
I agree that informed opinions can be important and a group of football experts might have insights into the game that mere mortals might not. Many of the committee members are former coaches and athletic directors, but I am concerned that opinions from former coaches and athletic directors might be tainted by the teams and conferences they come from (they might not even know they are biased). What is the difference between an informed and prejudiced opinion? I am not sure, but can these men and women be truly neutral? There is a massive amount of scientific research that shows that we have difficulties being unbiased. Nobel laureate Daniel Kahneman has written an entire book on heuristic and cognitive biases1. A good example comes from witnesses of crimes or traffic accidents. Any good detective knows to take eye-witness testimonies before the witnesses have had a chance to discuss the event because studies show that witnesses that share information will tend to foster similar errors about the event. And the research also shows that eye-witnesses are notoriously inaccurate. Elizabeth Loftus has written an immensely entertaining book about her research involving witness error and bias if you care to delve into the details2. Loftus writes: ” In my experiments, conducted with thousands of subjects over decades, I’ve molded people’s memories, prompting them to recall nonexistent broken glass and tape recorders; to think of a clean-shaven man as having a mustache, of straight hair as curly, of stop signs as yield signs, of hammers as screwdrivers; and to place something as large and conspicuous as a barn in a bucolic scene that contained no buildings at all. I’ve been able to implant false memories in people’s minds, making them believe in characters who never existed and events that never happened.” A recent study based on statistical analyses has shown that the writers’ and coaches’ college football polls are significantly affected by such things as point spreads and television coverage3.
If humans have all of these susceptibilities toward bias, why do we use humans to choose who plays in college football’s vaunted playoff system? Well, because humans are biased — they think they can choose better than nuanced mathematical formulas. But the nuanced mathematical formulas are completely unbiased — in other words, they use only raw game data usually related to wins/losses and score differentials. We can remove the most biased element in the system, humans, by relying specifically on science, logic, and mathematics rather than art or whatever else the committee protocol calls human intervention. It is absolutely archaic in the day of big data to ignore analytical models in favor of subjective comparisons. Do the coaches, atheletic directors, and politicians (e.g., Condoleezza Rice is on the committee but has virtually no “football experience” in her background) that make up the football committee understand the value of algorithms? I am not sure, but there is a wealth of research that says they should.
From my experience on football boards and chat rooms, nothing gets a fan’s dander up more than claiming computer models are unbiased. But they are. They start with only formulas melded together into computer algorithms. And the algorithms are based on sound mathematical principles and proofs. There are many college football algorithms used in computer ranking models and many of them are considered proprietary. More than 60 are compiled on www.mratings.com. The math can get pretty intense, but if you are interested in the details of the known algorithms, I recommend the book Who’s #1?: The Science of Rating and Ranking by Amy N. Langville at the College of Charleston and Carl Meyer at North Carolina State University4. The people that do these algorithms are steeped in mathematical prowess. For example, the Colley matrix was done by Wes Colley after he completed his PhD at Princeton University in astrophysics. Although the math can get tricky, the principle is rather simple. The algorithms typically involve matrices and vectors that simultaneously consider not only which team beat which opponents but which teams the opponents beat, and which teams those opponents beat out into n dimensions. In addition, difficulty of schedule and score differentials can also be incorporated into the algorithms. When we watch college football we get a sense of which team is best by comparing how each team plays against its opponents. But such opinions are hopelessly mired in the biases and are enhanced by the fact that preseason polls skew our perceptions before the season begins. The algorithms do precisely what human perception is trying to do but without any biases and simultaneously with a huge array of data 5.
I don’t understand the reluctance of the powers to be in college football to incorporate mathematical equations into the playoff system. These types of algorithms permeate the business community. Google’s PageRank ranks web pages using some of the same algorithms as computer models do to rank teams. Although it is a carefully guarded secret, Langville and Meyer 6 concluded, based on patent documents, that Google’s algorithm uses the Perron-Frobenius theorem which is also used by James Keener in his football rankings 7. The BellKor company won a Netflix prize of 1 million dollars for writing an algorithm that was 10% better than the one created by Netflix. Every time Netflix suggests a movie, it is exploiting the same kinds of algorithms used in football rankings. In fact, Langville and Meyer applied the algorithms behind the Colley and Massey methods to the Netflix movie ratings database and came up with a list of the top movies in their book (pages 25-27). No one complains about page ranks or movie suggestions being too nuanced in rigor. Can you imagine a committee trying to ascertain page ranks? No one promotes the “eye test” to rank web pages even though the eye test is commonly prescribed as the only legitimate way to determine which teams are the best in college football. Isn’t it obvious that this is about control rather than human abilities versus computer algorithms?
Deep data has been integrated into almost all sports. Witness the way professional baseball has dispensed with the traditional positions on the field in favor of moving players to positions where the hitter is most likely to hit. It is not unusual to see a shortstop in shallow center. The game was primarily changed when computers had the computing power to handle the large amounts of data that could be collected. Read Moneyball by David Lewis 8 to see how manager Billy Beane used statistics (now called sabermetrics) to take a struggling Oakland Atheletics team to the playoffs. Opinions of seasoned professional scouts that relied on the eye test to recruit talent have gone the way of the dodo bird.
In my opinion, nothing seems more egregious in the polls than the way teams are punished for losing when they play difficult schedules and other teams are favored for winning even with cupcake schedules. Let’s pretend we can determine the thirteen best teams in college football before the season and the number 13 team has scheduled all the top twelve teams during the regular season. The number 13 team could finish the season 0-12. The AP and Coaches polls would be extremely hard on the team and they would never rank the team in the top 25 even though we know by definition they are the 13th best team in the nation. But the computer algorithms would recognize the logic behind the difficult schedule and although they might not rank them 13th, they would probably have a good showing. The counter to this example is a team with a fluff schedule. The polls are notorious for ranking teams with perfect records higher than is sometimes justified when strength of schedule is considered. In theory, any team in the FBS could win all their games if they played lesser ranked opponents on their schedule. Fortunately it appears that the playoff selection committee has recognized that strength of schedule is an important factor and they do consider it. However, the committee’s willingness to consider head-to-head games seems logically misplaced. Let’s go back to our top 13 ranked teams again. If the number four team lost to the number 5 team and the number 5 team lost to the number 13 team, the committee would indubitably place the number 5 team into the playoffs over the number 4 team based on the silly head-to-head rule even though the computer algorithms would recognize the problem and consider the entire schedule of each team.
Although we don’t like to admit it, statistically improbable events can have a huge impact on single games which may never be noticed by the committee (or the computer algorithms for that matter – see the section on betting below). If anyone saw the national championship last year you could not be faulted for thinking that Clemson may have been the best team in the country even though they lost to Alabama (it hurts me to say this because I am an alumnus of Alabama and a huge Crimson Tide fan – I go way back to the Bear). Alabama had an onside kick that they recovered. It appeared to change the momentum of the game and yet, the probability of that onside kick being perfectly placed seems unlikely. Watch it for yourself below. Bama also needed a kickoff return and a few turnovers on their way to a 45-40 national championship victory. The point being that minutiae that would otherwise not have a big impact can and does play a role. It is the butterfly effect which teaches us that there is no right answer when it comes to rankings. The best we can do is create an unbiased mathematical system rooted in statistics and deep data with as little input as possible from naturally biased humans.
Last year I set out to test the college football computer algorithms by setting up a spreadsheet which monitored theoretical bets of $100 on each of the college games beginning on November 8 through the college bowl games. I waited until late in the season because, in theory, the algorithms work better with more data. I used Sagarin‘s predictor ranking which includes score differentials and home-team advantage. First a few words about these items. It is true that teams can run up the score although it rarely happens on a consistent basis. But most algorithms correct for large score differentials9 to avoid any advantages gained in the rankings from running up scores. Home-team advantage is an interesting subject in itself and is usually attributed to psychological effects of playing in a stadium full of the home-team fans. But these effects are difficult to test. The subject has also been addressed in the scientific literature, and much to my surprise, some studies show that referees can be influenced by the home crowd. For example, Harvard professor Ryan Boyko and his colleagues found that statistically referees favored the home team in 5,244 English Premier League soccer matches over the 1992 to 2006 seasons10. Regardless of the reasons for the effect of home-field advantage, algorithms can correct for it. Sagarin calculates a score to be added to the home team when betting.
The results of my theoretically betting are shown below for each week (the bowl season caused the number of games to vary in December). Had I bet $100 on each of the 287 games monitored I would have lost $700. So what’s so terrific about a ranking system that loses money in Vegas? It is simple – point spread. If Vegas lost money on college football games, there would be no betting. It is common for the media to give point spreads in games as a reflection of who Vegas thinks will win the game. But spreads are not about who is favored, the spreads are about enticing bettors to bet. With a point spread, Vegas does not have to predict winners, all they need to do is entice bettors by making the point spread seem to favor one side or the other. Vegas knows how to make money on all those built-in biases we have. They collect a fee (called a vig or juice) for handling the bet, and as long as they have about the same number of losers and winners, they take home a tidy profit. To make sure the winners and losers are equal, they shift the spread during the course of the week as the bets are placed assuring that the same amount of bettors are on both sides of the spread. Even the computer algorithms can’t beat the crafty Vegas’ bookies. Even though the computer algorithms are very good at predicting winners (near 60%), no algorithm (or, for that matter, any human) can beat spreads on a consistent basis11. But people keep trying.
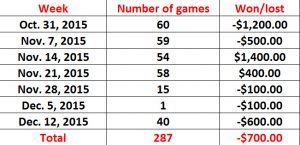 Amount of money theoretically lost using Sagarin rankings.
Langville and Meyer point to two reasons why computer algorithms don’t beat point spreads; 1) The computer algorithms are created to predict rankings not score differentials. In the computations, they ignore important scoring factors such as strength of defensive backfields against high-octane passing attacks which might create lopsided scores even though the rankings rate both teams average. Then there are always the statistical flukes that occur in games as mentioned above which cannot be predicted. 2) Spreads are also difficult to predict particularly in football because points are tabulated in sets of usually 3, 6 or 7. Therefore, games tend to be multiples of these numbers rather than simple evenly distributed numbers.
I must conclude from the data that the only way to select the four teams that play at the end of the year in college football is to use computer algorithms. There should still be a committee that decides how to weigh such things as league championships. It will also be extremely important to make sure that the algorithms used are completely understood by the committee (no black-box proprietary claims). The algorithms need to be analyzed to determine which equations and factors give the most meaningful results and changed accordingly. Score differentials should be included within the algorithm after they have been corrected for the potential of teams running up the scores.
Appendix – a brief overview of linear algebra and rankings
There is no way in an essay I can do justice to the subject. But I did want to emphasize how these equations eliminate any bias or human influence. I highly recommend the Khan Academy if you want a brief overview of linear algebra.
Rather than use my own example, I have decided to use the data presented by Langville and Meyer because it is easier to understand when every team in the example has played every other team in the division. The data shown below comes from the 2005 Atlantic Coast Conference games.
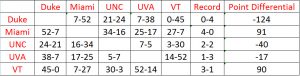 The 2005 data from the Atlantic Coast Conference
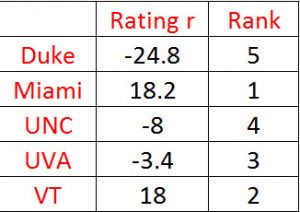
The Massey method of ranking teams was developed by Kenneth Massey for his honor’s thesis in mathematics while he was an undergraduate at Bluefield College in 1997. He is currently an assistant professor at Carson Newman University. Using his equations, the table above can be converted into a linear algebra equation of the form Mr = p where M is the matrix containing information about which teams played which other teams, r is the rating factor (which is equated to the ranking), and p is the sum of each team’s score differentials:
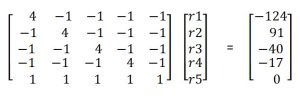
Note the diagonals of M are the games played and each -1 in the matrix shows that each team played every other team. The last row is a trick Massey used to force the ranks to sum to 0. The solution is calculated by inverting the matrix M and multiplying times p to obtain the following results 12:
- Kahneman, D. (2011) Thinking, Fast and Slow: Farrar, Straus and Giroux. ↩
- Loftus, E. and Ketcham, K. (1994) The Myth of Repressed Memories: False Memories and Allegations of Sexual Abuse: St. Martin’s Press ↩
- Paul, R. J., Weinbach, A. P., and Coate, P. (2007) Expectations and voting in the NCAA football polls: The wisdom of point spread markets: J. Sports Economics, 8, 412 ↩
- Langville, A.N. and Meyer, C. (2012) Who’s #1?: The Science of Rating and Ranking: Princeton University Press ↩
- I would like to thank Amy Langville for suggested changes here ↩
- see ref. 4 ↩
- Keener, J. (1993) The Perron-Frobenius theorem and the ranking of football teams: Society for Industrial and Applied Mathematics, 35, 80 ↩
- Lewis, D. (2003) Moneyball: W. W. Norton & Company ↩
- see ref. 4 ↩
- Boyko et al. (2007) Referee bias contributes to home advantage in English Premiership football: Journal of Sports Sciences, 25, 1185 ↩
- see ref. 4 ↩
- see ref. 4 for details ↩
Embryonic stem cells (ES cells) are remarkable. They come from animal (including human) embryos and can morph into any cell in the body such as brain, bone marrow, intestine, muscle, or blood cells. Biologists call them pluripotent and can isolate them from an embryo and grow them in laboratory petri dishes. In the halcyon days of early stem-cell research, it did not escape the attention of scientists that genetic changes could be made to an ES cell, the cell could then be inserted back into an embryo, and the embryo placed into the womb where it would differentiate into all the cells of the body with the new genetic modification. The process became so widespread in the early 1990s that biologists referred to the genetically modified animals born as transgenic. An example that caught the attention of the world was a mouse that had a gene from a jellyfish that made it glow in the dark (under blue lamps). It was as if a grand gift had been given to geneticists that enabled them to understand how genes functioned. Mice could be made to double in size, develop Alzheimer’s disease, grow cancer tumors, age prematurely, increase memory, or erupt with epilepsy all through gene manipulation. It was a remarkable way for scientists to study genetic diseases. There was just one problem — human ES cells did not respond favorably to genetic modifications the way mouse ES cells did. There would be no transgenic humans anytime soon even if ethical issues were overcome.
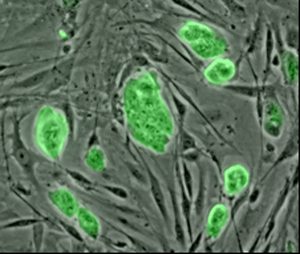 Embryonic mouse stem cells
Meanwhile, geneticists were probing a myriad of other ways to correct specific genetic disorders. One group focused on a gene called ornithine transcarbamylase (OTC) which codes for an enzyme that breaks down proteins in the liver. Without the enzyme, a product of the protein, ammonia, accumulates throughout the body. As you might imagine, ammonia buildup in the body can have devastating consequences, and most children do not survive into adulthood with the genetic disorder. Enter Jesse Gelsinger who had a mild case of OTC deficiency1. Mark Batshaw and James Wilson, then at the University of Pennsylvania, postulated that they could add the OTC gene to a cell’s DNA from Gelsinger and insert it back into his body via an adenovirus (viruses reproduce by entering the body and injecting either DNA or RNA into a living cell, effectively taking over the cell to reproduce more copies of themselves). The hope was that the virus would insert the corrected DNA into Gelsinger’s liver cells which would then synthesize the requisite enzyme needed by Jesse. The treatment worked in mice but had mixed results in monkey trials — some monkey immune systems responded in drastic ways causing liver failure and other disorders. Batshaw and Wilson responded by making the virus less potent and reducing the dose for the proposed trial with Gelsinger. In 1997, they approached the Recombinant DNA Advisory Committee (RAC) of the government’s National Institute of Health for approval. RAC agreed, and Jesse and his father were excited volunteers, convinced that Jesse’s close encounters with death from food reactions, regimented diet, and the plethora of pills he took was coming to an end.
On September 9, 1993, Jesse began his trial of viral injections. Four days later he was dead from a massive immune reaction to the virus. The press reports set off a chain reaction energizing Congress to initiate hearings, district attorneys investigating, the university back pedaling, and official inquiries launched by the FDA and RAC. When it was discovered that there was a “pattern of neglect” with the research by Batshaw and Wilson, the FDA halted all trials in other laboratories and a strict moratorium fell over the entire research discipline. We will never know how much of the response was an effort to point blame away from governmental agencies, but Batshaw and Wilson became the “fall guys” and genetic research would be impacted for a decade. I recognize the need for caution and ethical considerations, but I also know that there are children dying from diseases like OTC every day. I am sure many of them and their parents would gladly accept the chance of survival beyond childhood via potentially risky experiments. Did we throw the baby out with the bath water? After all, Jesse died wanting to help others by finding a cure for OTC. He did not die from the trial’s basic premise. He died because his body had highly reactive antibodies to the virus because he had probably been exposed to a similar adenovirus in his past.
Fortunately, Jesse’s disturbing death did not affect genetic diagnosis – attributing genes to diseases. Examples include the BRCA1 gene associated with breast cancer, CNV mutations linked to schizophrenia, and ADCY5 and DOCK3 genes related to neuromuscular disease. I highly recommend Siddhartha Mukherjee’s new book entitled The Gene: An Intimate History2 for further reading.
But to set the stage for the technology available today, we need to look at in vitro fertilization (IVF). In IVF, an embryo is formed from the fertilization of an egg by a sperm outside of the body. The single-cell embryo is bathed with nutrient-rich fluids in an incubator and left to divide for three days until there are 8 to 16 cells. The embryo is then implanted into a woman’s womb. Remarkably, if a few cells are removed from the growing embryo in the incubator, the embryo is unaffected. It simply replaces the lost cells. Usually several eggs are harvested for IVF and fertilized. Cells can then be removed from each embryo and genetically tested or screened for mutations allowing only a fertilized egg with no known serious genetic disorders to be implanted in the womb. Genetic testing in this way has been done since the late 1980s and is referred to as preimplementation genetic diagnosis (PGD). It is eugenics without the terrible baggage that the word has carried from past diabolical experiments (think Mengele and the Nazis). But that does not mean that the method has not been misused. PGD is being used surreptitiously to select for sex particularly in India and China even though selecting for gender is banned there. It is estimated that as many as 10 million females have “disappeared” from PGD, abortion, infanticide, or neglect of female children3.
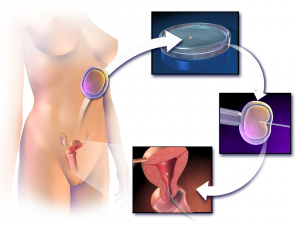 Diagram of in vitro fertilization – Wikipedia

According to Mukherjee, there have been three principles that guide doctors in deciding which embryos will not be implanted during IVF. First, the gene needs to lead to a serious life-threatening disease with almost 100 percent chance of the child or adult developing the disease. Cystic fibrosis is a good example – a single gene causes the genetic disease. The disorder affects the lungs primarily, causing chronic coughing from frequent lung infections. Life expectancy is about 46. The misery is not limited to the lungs. Sinus infections, poor growth, clubbing of digits, fatty stools, and infertility (among males) are just some of the side effects. Second, the development of the gene will lead to “extraordinary suffering”. And finally, there must be a consensus among the medical community that the intervention is morally and ethically sound and the family involved has complete freedom of choice.
Even so, the Roman Catholic Church (and other religious institutions) has strongly objected to IVF and related gene technologies. John Hass, a Catholic theologian, states: “One reproductive technology which the Church has clearly and unequivocally judged to be immoral is in vitro fertilization or IVF. Unfortunately, most Catholics are not aware of the Church’s teaching, do not know that IVF is immoral, and some have used it in attempting to have children… In IVF, children are engendered through a technical process, subjected to “quality control,” and eliminated if found “defective.”4. Honestly, I don’t understand where this moral imperative comes from. If there is a God, He/She must have understood that we would eventually discover how to cure genetic diseases. Apparently Hass and the Church find no fault with technologies that would correct the problem after the embryo is in the womb but chaff at the idea of choosing to avoid the disease before the embryo is placed in the womb. I suspect that Hass might change his mind if he had to watch someone die slowly from a disease like cystic fibrosis5. Clearly, our society will continue to grapple with the ethical and moral issues of gene technologies particularly now that research is making social engineering theoretically “available”. Mukherjee discusses the identification of a gene related to psychic stress to emphasize how blurred the ethical decisions are potentially becoming. Where society draws the line is going to be as important as the genetic technology itself. But these ethical dilemmas are just the tip of the iceberg.
Improved safety and more careful oversight has gradually led to better research. New viruses have been developed to effectively deliver gene-altered DNA or RNA to cells that avoid catastrophic immune responses similar to what happened to Jesse Gelsinger. In 2014, viral delivery systems successfully treated hemophilia – the genetic disorder that prevents blood from clotting. And although the setback that genetic engineering suffered in the 1990s in the aftermath of Jesse’s death had been overcome as the new millennium approached, germ-line therapy was set back again when George W. Bush drastically reduced the use of ES cells in federal research programs in 2001. Germ-line therapy is the modification of the human genome in reproductive cells so that the modified gene is passed on to offspring. Imagine ridding genomes of gene mutations that cause cystic fibrosis or breast cancer (BRCA1) forever in families. Yet because ES cells are frequently obtained from embryos left over from IVF, Bush clamped down on the research (presumably based on pressure from the religious right) which nearly extinguished United States progress in the field for nearly a decade. I understand the abortion debate, but collecting ES cells from embryos that will never be implanted in woman’s womb seems to be carrying the abortion issue to drastic extremes.
Jennifer Doudna of the University of California, Berkeley and Emmanuelle Charpentier of the Helmholtz Centre for Infection Research knew from earlier research that bacteria had RNA that could find and recognize DNA in a virus and then deliver a protein which cut the virus DNA, thus disabling it – an effective way bacteria fought off viral attacks. By 2012, they were not only able to program the process to seek and cut any specified section of DNA, but they learned how to flood the region near the cut with desired DNA fragments that the cut DNA incorporated into its genome. In effect, they had created a gene splicing technique they designated CRISPR/Cas96 (clustered regularly interspaced short palindromic repeats). In other words, Doudna and Charpentier had discovered a means to exchange a serious mutant gene like the cystic fibrosis gene with a harmless gene. The dawn of genetic editing had begun7.
About the same time that Doudna and Charpentier were developing the CRISPR technology, scientists at Cambridge, England and at the Israeli Weizmann Institute were discovering how to make ES cells into primordial germ cells – these are the cells that develop into the sperm and egg in the embryo. The brave new world predicted by Huxley nearly 100 years ago in 1932 is upon us. The technology is now available to form a germ line cell which can be genetically modified with CRISPR technology. The modified cells can then be converted to sperm and eggs to form an embryo which will produce a genetically modified human through IVF – a transgenic human. However, as you might imagine, there are strict controls and bans on this research in the United States based on ethical and moral issues. Scientists are forbidden to introduce genetically modified cells that will develop into embryos directly into humans and ES cells cannot be genetically modified if they will form into sperm and egg cells. Most other countries have followed the US lead with similar bans. Mukherjee tries to explain the concern: “The crux, then, is not genetic emancipation (freedom from the bounds of hereditary illness), but genetic enhancement (freedom from the current boundaries of form and fate encoded by the human genome). The distinction between the two is the fragile pivot on which the future of genome editing whirls.” It is clear that we are wrestling with our past history of the misplaced promotion of horrible eugenics programs. I asked Doudna to clarify the reason for a moratorium: “the moratorium is not a call to outright ban engineering of the human germ line. Instead, it suggests a halt to such clinical use until a broader cross section of scientific, clinical, ethical, and regulatory experts, as well as the public at large have a chance to fully consider the ramifications.”
But we may not have the luxury of waiting until the ethics and morals of the science are thoroughly debated. In 2015, Junjiu Huang and his team at Sun Yat-sen University in Guangzhou, China, used CRISPR to eliminate a gene that causes a blood disorder in human embryos. There were problems in the products and the procedure was stopped (although there was never any intention of allowing the embryos to mature in a womb). The experiments set off international alarms and the scientific journals Nature, Cell, and Science refused to publish the paper. The paper was eventually published in Protein + Cell. Huang has made it clear that he will continue to pursue experiments to correct problems that surfaced during the previous work. “They did the research ethically” noted Tetsuya Ishii of Hokkaido University in Sapporo, Japan in Science, but several genetic watchdog groups called for an end to the procedures. Other scientists including a Nobel laureate were not disturbed by the research as long as the experiments were limited to clinical applications8.
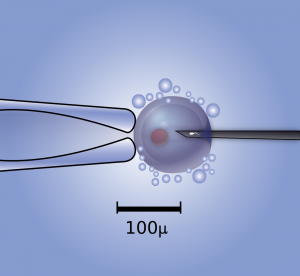 Genetic editing in human embryos.
The incident with Junjiu Huang reminds me of the work that has been done on game theory. As far back as the 1920s one of the leading lights in mathematics, John von Neumann at the Institute of Advanced Study where Albert Einstein and Kurt Gödel worked (closely associated with Princeton University), sought to define, through mathematical expressions, logical procedures in games that could be applied to real-life scenarios. In his superb book Prisoner’s Dilemma: John von Neuman, Game theory, and the Puzzle of the Bomb, William Poundstone summarizes von Neumann’s work: “Von Neumann demonstrated mathematically that there is always a rational course of action for games of two players, provided their interests are completely opposed9.” One of the early applications of work on game theory came when the United States was deciding to build a hydrogen bomb – a huge leap in destructive capabilities compared to the atomic bomb. Many prominent scientists, such as Robert Oppenheimer, the director of the Manhattan Project, were outspoken against it. Seemingly they reasoned, the best strategy would be to cooperate with the Soviet Union whereby both countries would agree not to develop the H-bomb. The research was expensive and it would generate thousands of bombs that would be stockpiled and probably never be used. Game theory logic did not concur. There was only one possible step according to the logic of “game” brinkmanship between the US and the Soviets – build the H-bomb no matter whether the Soviets were willing to agree to a moratorium or not. There was simply no way to be absolutely sure the Soviets would live up to any potential agreement.
I think the same strategy is true with germ-line experiments. The logic is clear – it seems the Chinese are going to develop the technology regardless of what we do and not having the technology while other countries do could be detrimental to the best interests of the United States. The value of developing germ-line therapy seems even more crucial than, say, the H-bomb because the therapy will potentially lead to cures for horrible genetic diseases. I recognize the need to be discreet and careful, but we also need not dally on something so important. In December of 2015, the International Summit on Human Gene Editing was sponsored by the US National Academy of Sciences, the US Academy of Medicine, the Chinese Academy of Sciences, and the Royal Society of London. The planning committee summarized recommendations for “the development and human applications of genome editing” with agreements made to have future summits. The recommendations can be reviewed in an editorial by Theodore Friedmann in Molecular Therapy10. All I can say is that the sides are talking, and that is important. The research continues with some controls.
- In Jesse’s case, the gene was not inherited but was caused by a mutation in only one cell before birth. The result was unusual in that not all of his cells were OTC deficient as might be expected if he had inherited the trait. ↩
- Mukherjee, S. (2016) The Gene: An Intimate History, Scribner ↩
- see ref. 2 ↩
- see for example, Haas, J. M. (1998) Begotten not made: A catholic view of reproductive technology ↩
- I was raised a Roman Catholic, and I know that Catholics believe in divine inspiration. That is, they believe the Pope with or without the input of his advisers makes a decision on the morality of the issue with the understanding that the decision is inspired directly by God. I would hasten to point out that the terrorists that took down the World Trade Center believed they were divinely inspired also so believing does not make it so. I sometimes wonder if these men (and I emphasize men because there are no women in the upper echelons of the Holy See) ever wonder if their opinions are really divinely inspired. They place a great deal of confidence in a decision that will bring immense misery into the world – consider all those Catholics that refuse to use IVF and have children with serious genetic disorders ↩
- The Cas9 was the protein that performed the cutting. ↩
- see Exterminating invasive species with gene drives ↩
- Kaiser, J. and Normile, D. (2015) Embryo engineering study splits scientific community: Science, 348, 486-487 ↩
- Poundstone, W. (1992) Prisoner’s Dilemma: John von Neuman, Game theory, and the Puzzle of the Bomb: Anchor Books ↩
- Friedmann, T. (2016) An ASGCT Perspective on the National Academies Genome Editing Summit: Molecular Therapy, 24, 1-2 ↩
After the Madrid terrorist bombing on March 11, 2004, a latent fingerprint was found on a bag containing detonating devices. The Spanish National Police agreed to share the print with various police agencies. The FBI subsequently turned up 20 possible matches from their database. One of the matches led them to their chief suspect, Brandon Mayfield, because of his ties with the Portland Seven (Mayfield, a lawyer, represented one of the seven American Muslims found guilty of trying to go to Afghanistan to fight with the Taliban in an unrelated child custody case) and his conversion to Islam (Mayfield was in the FBI database because of his arrest for burglary in 1984 and his military service). FBI Senior Fingerprint Examiner Terry Green considered “the [fingerprint] match to be a 100% identification”1. Supervisory Fingerprint Specialist Michael Wieners and Unit Chief, Latent Print Unit, John T. Massey with more than 30 years experience “verified” Green’s match according to the referenced court documents. Massey had been reprimanded by the FBI in 1969 and 1974 for making “false attributions” according to the Seattle Times2. Mayfield was arrested and held for more than 2 weeks as a material witness but was never charged while the FBI argued with the Spanish National Police about the veracity of their identification. Apparently the FBI ignored Mayfield’s protests that he did not have a passport and had not been out of the country in ten years. They also initiated surveillance of his family by tapping his phone, bugging his home, and breaking into his home on at least two occasions3. All legal under the relatively new Patriot Act.
Meanwhile in Spain, the Spanish National Police had done their own fingerprint analysis and eventually concluded that the print matched an Algerian living in Spain — Ouhnane Daoud. But the FBI was undeterred. The New York Times4 reported that the FBI sent fingerprint examiners to Madrid to convince the Spanish that Mayfield was their man. The FBI outright refused to examine evidence the Spanish had and according to the Times “relentlessly pressed their case anyway, explaining away stark proof of a flawed link — including what the Spanish described as tell-tale forensic signs — and seemingly refusing to accept the notion that they were mistaken.”
The FBI finally released Mayfield and followed with a rare apology for the mistaken arrest. Mayfield subsequently sued, and American taxpayers shelled out $2 million when the FBI settled the case. More importantly, the FBI debacle occurred during a debate among academics, government agencies, and within the courts about the “error rate” associated with fingerprint analyses5. But before I address the specific problems with fingerprint identification let’s talk about the Daubert v. Merrell Dow Pharmaceuticals (1993) court case. The details are fairly banal and would have been meaningless to this essay except for the fact that it reached the Supreme Court and established what is now referred to as the Daubert standard for admitting expert witness testimony into the federal courts6. In summay, the judge is responsible (a gatekeeper in Daubert parlance) for making sure that expert witness testimony is based on scientific knowledge7 Furthermore, the judge must make sure the information from the witness is scientifically reliable. That is, the scientific knowledge must be shown to be the product of a sound scientific method. Finally the judge must ensure that the testimony is relevant to the proceedings which loosely translated means the testimony should be the product of what scientists do – form hypotheses, test hypotheses empirically, publish results in peer-reviewed journals, and determine the error in the method involved when possible. Finally the judge should make a determination of the degree the research is accepted by the scientific community8.
“No fingerprint is identical” – it has become almost a law of nature within forensic fingerprint laboratories. But no one knows whether it is true or not. That has not stopped the FBI from maintaining the facade. In a handbook published by the FBI in 19859 they state: “Of all the methods of identification, fingerprinting alone has proved to be both infallible and feasible”. I think that fingerprints are an exceptionally good tool in the arsenal of weapons against crime, but it is essentially unscientific to perpetuate infallibility. The fact is that the statement “all fingerprints are not identical” is logically unfalsifiable10. And the more scientists argued against the infallibility of fingerprinting the more the FBI became entrenched in their position after the Mayfield mistake11. Take, for example, what Massey said shortly after the Mayfield case: “I’ll preach fingerprints till I die. They’re infallible12.” It may be true that no fingerprints are perfectly alike (I suspect it is true) but it is also true that no fingerprint of the same finger is alike. The National Academy of Sciences asserted that “The impression left by a given finger will differ every time, because of inevitable variations in pressure, which change the degree of contact between each part of the ridge structure and the impressions medium13.” The point therefore becomes not if all fingerprints are unique but whether laboratories have the abilities to distinguish between similar prints, and if they do, what is the error in making that determination.
U.S. District Judge Louis H. Pollak ruled in a January, 2002, murder case that fingerprint analyses did not meet the Daubert standards. He reversed his decision after a three-day hearing. Donald Kennedy, Editor-in-Chief of Science opined “It’s not that fingerprint analysis is unreliable. The problem rather, is that its reliability is unverified either by statistical models of fingerprint variation or by consistent data on error rates14 15.” As one might expect, the response by the FBI and federal prosecutors to Pollak’s original ruling and subsequent criticism was a united frontal attack not based on statistical analyses verifying the reliability of fingerprint identification but the infallibility of the process based on more than 100 years of fingerprint identification conducted by the FBI and other agencies around the world. The FBI actually argued that the error rate was zero. FBI agent Stephen Meagher stated during the Daubert hearing16, to Lesley Stahl during an interview on 60 Minutes17, and to Steve Berry of the Los Angeles Times during an interview18 that the latent print identification “error rate is zero”. How can the error rate be zero when documented cases of error like Mayfield exist? Even condom companies give the chance of pregnancy when using their product.
In 2009, the National Academy of Sciences through their committee The National Research Council produced a report on how forensic science (including fingerprinting) could be strengthened19. Perhaps the most eye-opening conclusion of the report is that analyzing fingerprints is subjective. It is worth quoting their entire statement: “thresholds based on counting the number of features [see diagram below] that correspond, lauded by some as being more “objective,” are still based on primarily subjective criteria — an examiner must have the visual expertise to discern the features (most important in low-clarity prints) and must determine that they are indeed in agreement. A simple point count is insufficient for characterizing the detail present in a latent print; more nuanced criteria are needed, and, in fact, likely can be determined… the friction ridge community actively discourages its members from testifying in terms of probability of a match; when a latent print examiner testifies that two impressions “match,” they [sic] are communicating the notion that the prints could not possibly have come from two different individuals.” The Research Council was particularly harsh on the ACE-V method (see the diagram below) used to identify fingerprint matches: “The method, and the performance of those who use it, are inextricably linked,and both involve multiple sources of error (e.g., errors in executing the process steps, as well as errors in human judgment).” The statement is particularly disconcerting because, as the Research Council notes, the analyses are typically performed by both accredited and unaccredited crime laboratories or even “private practice consultants.”
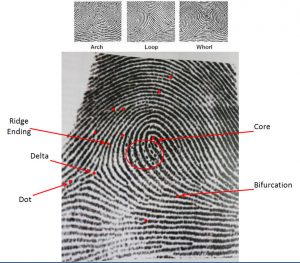 The fingerprint community in the United States uses a technique known via an acronym ACE-V – analyses, comparison, evaluation, and verification. I give an example here to emphasize the basic cornerstone of the process which involves comparison of friction-ridge patterns on a latent fingerprint to known fingerprints (called exemplar prints). Fingerprints come in three basic patterns: arches, loops, and whorls as shown at the top of the diagram. The objective in the analysis is to find points (also called minutiae) defined by various patterns formed by the ridges. The important varieties are shown above. For example, a bifurcation point is defined by the split of a single ridge into two ridges. I have shown various points on the example fingerprint. Once these points are ascertained by the examiner, the points are used to match to similar points in the exemplars in their relative spatial locations. It should be obvious that the interpretation of points can be problematic and is subjective. For example, note the region circled where there are many “dots” which may be related to ridges or may be due to contaminants. There is still no standard used in the United States for the number of matching points required to obtain a “match” (although individual laboratories do set standards). Computer algorithms, if used, provide a number of potential matches and examiners determine which of the potential matches, if any, is correct. The method appears straight forward but in practice examiners have trouble agreeing even on the number of points due to the size of the latent print (on average latent prints are typically one fifth of the surface of an exemplar print), smudges and smearing, the quality of the surface, the pressure of the finger on the surface, etc.20 There is another technique developed in 2005 called Ridges-in-Sequence system (RIS)21. For a more detailed description of latent fingerprint matching see Challenges to Fingerprints by Lyn and Ralph Norman Haber 22
Now you might be thinking that the Mayfield case was unusual given the FBI and other agencies promote infallibility, but Mayfield seems to be the tip of the iceberg! Simon Cole of the University of California, Irvine23 has documented 27 cases of misidentification (Cole excluded cases of matches related to outright fraud) up through 2004 and underscores the high probability of many more incorrect undetected cases because of the relatively large number of documented mistakes that have slipped through the cracks (Cole uses the term “fortuity” of the discoveries of misidentification) — particularly when the FBI and other agencies are very tight lipped about detailing how they arrive at their conclusions when there is a match. These are quite serious cases involving people that spent time in prison for wrongful charges related to homicides, rape, terrorist attacks, and a host of other crimes.
It is worth looking at the Commonwealth v. Cowans case because it represents the first fingerprint-related case overturned on DNA evidence via the Innocence Project. On May 30, 1997, a police officer in Boston was shot twice by an assailant using the officers own revolver. The surviving officer eventually identified Stephen Cowans from a group of eight photographs and then from a lineup. An eye-witness that observed the shooting from a second story window also fingered Cowans in a lineup. The assailant, after leaving the scene of the crime, forcibly entered a home where he got a glass of water from a mug. The family present in the home spent the most time with the assailant and, revealingly, did not identify him in a lineup. The police obtained a latent print from the mug and fingerprint analyzers matched it to Cowans24. The conflict between eyewitness’ testimonies made the fingerprint match pivotal and led to a guilty verdict. After five years in prison, Cowans was exonerated on DNA evidence from the mug that showed he could not have committed the crime.
What do we know about the error (or error rate) in fingerprint analyses? Recently, Ralph and Lyn Haber of Human Factors Consultants have compiled a list of 13 studies (that meet their criteria through mid-2013) that review attempts to ascertain the error rate in fingerprint identification25. In the ACE-V method (see diagram above) the examiner decides whether a latent print is of high enough quality to use for comparison (I emphasize the subjectivity of the examination – there are no rules for documentation). The examiner can conclude that the latent print matches an exemplar, making an individualization (identification), she can exclude the exemplar print (exclusion – the latent does not match), or she can decide that there is not enough detail to warrant a conclusion26. The first thing to point out is that no study has been done where the examiners did not know they were being tested. This poses a huge problem because examiners tend to determine more prints inconclusive when being examined27. Keeping the bias in mind, let’s look in detail at the results of one of the larger studies reviewed by the Habers.
The most pertinent extensive study was done by Ulery et al.28. They tested 169 “highly trained” examiners with 100 latent and exemplar prints (randomly mixed for each examiner with latent-exemplar pairs that did not match and those that did match). Astoundingly, for pairs of latents that matched exemplars, only 45% were correctly identified. The rest were either misidentified (13% were excluded that should have been matched and a whopping 42% found to be inconclusive that should have been matched). I recognize that when examiners are being tested they have a tendency to exclude prints that they might otherwise attempt to identify, but even with this in mind, the rate is staggering. How many prints that should be matched are going unmatched in the plethora of fingerprint laboratories around the country? Put in another way, how many guilty perpetrators are set free on the basis of the inability of examiners to match prints? Regarding the pairs of latent and exemplar prints that did not match, there were six individualized (matched) that should not have been — a 0.1% error. Even if the error is representative of examiners in general (and there is plenty of reason to believe the error rate is higher according to the Habers), it is too high. Put another way, if 100,000 prints are matched with a 0.1 percent error rate, 100 individuals are going to be wrongly “fingered” as a perpetrator. And the way juries ascribe infallibility to fingerprint matches, 100 innocent people are going to jail.
There are a host of problems with the Ulery study including many design flaws. For one thing, the only way to properly ascertain error is through submitting “standards” as blinds within the normal process of fingerprint identification (making sure the examiners do not know they are attempting to match known latent prints). But there are many complications involved in the procedure that begins with not having any agreed upon standards or even rules to establish what a standard is29. I have had some significant and prescient discussions with Lyn Haber on the issues. Haber zeroed in on the problems at the elementary level: “At present, there is no single system for describing the characteristics of a latent. Research data shows [sic] that examiners disagree about which characteristics are present in a print.” In other words, there is no cutoff “value” that determines when a latent print is “of such poor quality that it shouldn’t be used”. Haber also notes that “specific variables that cause each impression of a finger to differ have not been studied”.
The obvious next step would be to have a “come to Jesus” meeting of the top professionals in the field along with scientists like the Habers to standardize the process. That’s a great idea, but none of the laboratory “players” are interested in cooperating — they are intransigent. The most salient point Haber makes in my opinion is the desire by various agencies to actively keep the error unknowable. She states that “The FBI and other fingerprint examiners do not wish error rates to be discovered or discoverable. Examiners genuinely believe their word is the “gold standard” of accuracy [but we most assuredly know they make mistakes] . Nearly all research is carried out by examiners, designed by them, the purpose being to show that they are accurate. There is no research culture among forensic examiners. Very very few have any scientific training. Getting the players to agree to the tests is a major challenge in forensic disciplines.” I must conclude that the only way the problem will be solved is for Congress to step in and demand that the FBI admit they can make mistakes, work with scientists to establish standards, and adequately and continuously test laboratories (including their own) throughout the country. While we wait, the innocent are most likely being sent to jail and many guilty go free.
A former FBI agent still working as a consultant (he preferred to remain anonymous) candidly told me that the FBI knows the accuracy of various computer algorithms that match latents to exemplars. He stated “When the trade studies were being run to determine the best algorithm to use for both normal fingerprint auto identification and latent identification (two separate studies) there were known sample sets against which all algorithms were run and then after the tests the statistical conclusions were analyzed and recommendations made as to which algorithm(s) should be used in the FBI’s new Next Generation Identification (NGI) capability.” But when I asked him if the data were available he said absolutely not “because the information is proprietary” (the NGI is the first stage in the FBIs fingerprint identification process – they match with the computer and send the latent with closest matches to the analyzers). Asking for the computer error rate should not be proprietary – the public does not have to know the algorithm to understand the error on the algorithm.
Of course, computer analyses bring an additional wrinkle to the already complex determination of error. Haber states “Current estimates are such that automated search systems are used in about 50% of fingerprint cases. Almost nothing is known about their impact on accuracy/error rates. Different systems use different, proprietary algorithms, so if you submit the same latent to different systems (knowing the true exemplar is in the data base), systems will or will not produce the correct target, and will rank it differently… I am intrigued by the problem that as databases increase in size, the probability of a similar but incorrect exemplar increases. That is, in addition to latents being confusable, exemplars are.” I would only emphasize that the FBI seems to know error rates on the algorithms but has not, as far as I know, released that data.
To be fair, I would like to give the reader a view from the FBI perspective. Here is what the former FBI agent had to say when I showed him comments made by various researchers: “When a latent is run the system generally produces 20 potential candidates based on computer comparison of the latent to a known print from an arrest, civil permit application where retention of prints is permissible under the law etc. It is then the responsibility of the examiner from the entity that submitted the latent to review the potential candidates to look for a match. Even with the examiner making such a ‘match’ the normal procedure is to follow up with investigation to corroborate other evidence to support/confirm the ‘match’. I think only a foolish prosecutor would go to court based solely on a latent ‘match’… it would not be good form to be in court based on a latent ‘match’ only to find out the person to whom the ‘match’ was attached was in prison during the time of the crime in question and thus could not have been the perpetrator.” Mind you, he is a personal friend whom I respect so I don’t criticize him lightly, but he is touting the standard line. Haber notes that in the majority of cases she deals with as a consultant “the only evidence is a latent”.
I suspect that the FBI along with lesser facilities does not want anyone addressing error because the courts may not view fingerprints as reliable, no, infallible, as they currently do, and the FBI might have to go back and review cases where mistaken matches are evident. As a research geochemist I have always attempted to carefully determine the error involved in my rock analyses so that my research would be respected, reliable, and a hypothesis drawn from the research would be based on reality. We are talking about extraordinary procedures to determine error on rock analyses. No one is going to jail if I am wrong. I will leave you with Lyn Haber’s words of frustration: “No lab wants to expose that its examiners make mistakes. The labs HAVE data: when verifiers disagree with a first examiner’s conclusion, one of them is wrong. These data are totally inaccessible… I think that highly skilled, careful examiners rarely make mistakes. Unfortunately, those are the outliers. I expect erroneous identifications attested to in court run between 10 and 15%. That is a wild guess, based on nothing but intuition! As Ralph [Haber] points out, 95% of cases do not go to court. The defendant pleads. So the vast majority of fingerprint cases go unchallenged and untested. Who knows what the error rate is?… Law enforcement wants to solve crimes. Recidivism has such a high percent, that the police attitude is, If [sic] the guy didn’t commit this crime, he committed some other one. Also, in many states, fingerprint labs get a bonus for every case they solve above a quota… The research data so far consistently show that false negatives occur far more frequently than false positives, that is, a guilty person goes free to commit another crime. The research data also show — and this is probably an artifact — that more than half of identifications are missed, the examiner says Inconclusive. If you step back and ask, Are fingerprints a useful technique for catching criminals, [sic] I think not! (These comments do not apply to ten-print to ten-print matching.)”
- The quote is from a government affidavit – Application for Material Witness Order and Warrant Regarding Witness: Brandon Bieri Mayfield, In re Federal Grand Jury Proceedings 03-01, 337 F. Supp. 2d 1218 (D. Or. 2004) (No. 04-MC-9071) ↩
- Heath, David (2004) FBI’s Handling of Fingerprint Case Criticized, Seattle Times, June 1 ↩
- Wikipedia ↩
- Kershaw, Sarah (2004) Spain and U.S. at Odds on Mistaken Terror Arrest, NY Times, June 5 ↩
- see the following for more details: Cole, Simon (2005) More than zero: Accounting for error in latent fingerprint identification: The Journal of Criminal Law & Criminology, 95, 985 ↩
- Actually the Daubert standard comes not only from Daubert v. Merrell Dow Pharmaceuticals but also General Electric Co. v. Joiner and Kumho Tire Co. v. Carmichael ↩
- I can’t help but wonder what it was based on prior to Daubert. ↩
- It remains a mystery to me as to how a judge would have the training and background to ascertain if an expert witness meets the Daubert standard, but perhaps that is best left for another essay ↩
- Federal Bureau of Investigation (1985) The Science of Fingerprints: Classification and Uses ↩
- What I mean by unfalsifiable is that even if we could analyze all the fingerprints of all living and dead people and found no match, we still could not be absolutely certain that someone might be born someday with a fingerprint that would match someone else. Some might think that this is technical science speak but in order to qualify as science the rules of logic must be rigorously applied. ↩
- Cole, Simon (2007) The fingerprint controversy: Skeptical Inquirer, July/August, 41 ↩
- Scarborough, Steve (2004) They Keep Putting Fingerprints in Print, Weekly Detail, Dec. 13 ↩
- National Research Council of the National Academies (2009) Strengthening Forensic Science in the United States: A Path Forward: The National Academy of Science Press ↩
- Error rate as used in the Daubert standard is somewhat confusing in scientific terms. Scientist usually determine the error in their analyses by comparing a true value to the measured value, inserting blanks that measure contamination, and usually doing up to three analyses of the same sample to provide a standard deviation about the mean of potential error for the other samples analyzed. For example, when measuring the chemistry of rocks collected in the field, my students and I have used three controls on analyses: 1) Standards which are rock samples with known concentrations determined from many analyses in different laboratories by the National Institute of Standards and Technology, 2) what are commonly referred to as “blanks” (the geochemist does all the chemical procedures she would do without adding a rock sample in an attempt to measure contamination), and three analyzing a few samples up to three times to determine variations. All samples are “blind” – unknown to the analyzers. The ultimate goal is to get a handle on the accuracy and precision of the analyses. These are tried and true methods and as I argue in this essay, a similar approach should be taken for fingerprint analyses. ↩
- Kennedy, Donald (2003) Forensic science: Oxymoron?, Science, 302, 1625. ↩
- Daubert v. Merrell Dow Pharmaceuticals, Inc. (1993) 509 US 579, 589 ↩
- Stahl, Lesley (2003) Fingerprints 60 Minutes, Jan. 5. ↩
- Berry, Steve (2002) Pointing a Finger: Los Angeles Time, Feb. 26. ↩
- see ref. 13 ↩
- Haber, L. and Haber, R. N. (2004) Error rates for human latent fingerprint examiners: In Ratha, N. and Bolle, R., Automatic Fingerprint Recognition Systems, Springer ↩
- Ashbaugh, D. R. 2005 Proposal for ridge-in-sequence: http://onin.com/fp/ridgeology.pdf ↩
- Haber, L. and Haber, R. N. (2009) Challenges to Fingerprints: Lawyers & Judges Publishing Company ↩
- see ref. 5 ↩
- One of the biggest criticism of the fingerprint community comes from the lack of blind tests — fingerprint analyzers often know the details of the case. Study after study has shown that positive results are obtained more frequently if a perpetrator is known to the forensic analyzers – called expectation bias: see, for example, Risinger, M. D. et al. (2002) The Daubert/Kumbo Implications of observer effects in forensic science: Hidden Problems of Expectation and Suggestions, 90 California Law Review ↩
- Haber, R. N. and Haber, N. (2014) Experimental results of fingerprint comparison validity and reliability: A review and critical analysis: Science and Justice, 54, 375 ↩
- see The Report of the Expert Working Group on Human Factors in Latent Print Analysis (2012) Latent Print Examination and Human Factors: Improving the Practice through a Systems Approach: National Institute of Technology ↩
- see ref. 24 ↩
- Ulery, B. T., Hicklin, R. A., Buscaglia, J., and Roberts, M. A. (2011) Accuracy and reliability of forensic latent fingerprint decisions: Proc. National Academy of Science of the U.S. ↩
- see ref. 14 ↩