
Note: this paper will be published in Skeptic Magazine in March, 2017
In case you are not familiar with how college football determines the four teams that are picked to contend for the national championship, I refer you to the Selection Committee Protocol which is a guide on how the committee chooses the four playoff teams at the end of the regular season and after the league championship games. The first words of the protocol are telling: “Ranking football teams is an art, not a science.” The protocol specifically calls into question any rigorous mathematical approach: “Nuanced mathematical formulas ignore some teams who “deserve” to be selected.” For those that are not aficionados of the college football selection, the previous selection process used computer polls as one third of the formula to determine the final two teams (before the four-team process was initiated in 2014 – the other two thirds of the formula came from the Associated Press and Harris polls). What I hope to show in this essay is that 1) humans are primed with natural biases (whether they realize it or not) and therefore, are not effective at simultaneously considering the huge amounts of data available and 2) computer algorithms are spectacularly successful at analyzing massive data bases, sometimes called “deep data”, to ascertain the best choices for the playoff system.
So what are the guidelines that instruct the 13 member college playoff panel? They are somewhat obvious and include “conference championship wins, strength of schedule, head-to-head competition, comparative outcomes of common opponents, and other relevant factors such as key injuries that may have affected a team’s performance during the season or likely will affect its postseason performance.” I hasten to point out that strength of schedule can only be determined by “nuanced mathematical” rigor. The guidelines fall into two categories: facts (e.g., conference champions) and opinions (e.g., whether a key injury will impact team performance). My argument is to eliminate opinions and choose the final 4 teams in the most rational and unbiased fashion — that is, use computer algorithms. Exceptions to the computer rankings could be made by the committee when facts like conference championships play an important role. For example, if Notre Dame and Florida State University each had one loss at the end of the season but the computer rankings had Notre Dame above FSU, the committee might override the computer rankings and choose FSU over ND if FSU won the Atlantic Coast Conference championship (ND is not in a conference and therefore cannot win conference championships). Let me spend some time justifying my proposed selection process.
I have created a table below which shows the top 15 teams in the final polls of the 2015 season along with their won-loss records for reference purposes. The first two polls are the AP and Coaches polls and the final two are the Sagarin and Colley computer polls. Keeping in mind that the computer algorithms that determine the computer polls have no human intervention (the data on wins and score differentials are simply entered into the matrices), it is remarkable that the computer polls agree so closely with the human polls particularly within the top 5 teams (remember there are 128 teams in the NCAA Division I Football Bowl Subdivision – FBS in 2015). The details of the computer algorithms are discussed at the end of the essay.
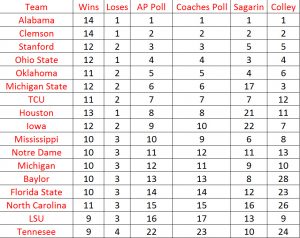 Rankings from the final week of the 2015 season.
I agree that informed opinions can be important and a group of football experts might have insights into the game that mere mortals might not. Many of the committee members are former coaches and athletic directors, but I am concerned that opinions from former coaches and athletic directors might be tainted by the teams and conferences they come from (they might not even know they are biased). What is the difference between an informed and prejudiced opinion? I am not sure, but can these men and women be truly neutral? There is a massive amount of scientific research that shows that we have difficulties being unbiased. Nobel laureate Daniel Kahneman has written an entire book on heuristic and cognitive biases1. A good example comes from witnesses of crimes or traffic accidents. Any good detective knows to take eye-witness testimonies before the witnesses have had a chance to discuss the event because studies show that witnesses that share information will tend to foster similar errors about the event. And the research also shows that eye-witnesses are notoriously inaccurate. Elizabeth Loftus has written an immensely entertaining book about her research involving witness error and bias if you care to delve into the details2. Loftus writes: ” In my experiments, conducted with thousands of subjects over decades, I’ve molded people’s memories, prompting them to recall nonexistent broken glass and tape recorders; to think of a clean-shaven man as having a mustache, of straight hair as curly, of stop signs as yield signs, of hammers as screwdrivers; and to place something as large and conspicuous as a barn in a bucolic scene that contained no buildings at all. I’ve been able to implant false memories in people’s minds, making them believe in characters who never existed and events that never happened.” A recent study based on statistical analyses has shown that the writers’ and coaches’ college football polls are significantly affected by such things as point spreads and television coverage3.
If humans have all of these susceptibilities toward bias, why do we use humans to choose who plays in college football’s vaunted playoff system? Well, because humans are biased — they think they can choose better than nuanced mathematical formulas. But the nuanced mathematical formulas are completely unbiased — in other words, they use only raw game data usually related to wins/losses and score differentials. We can remove the most biased element in the system, humans, by relying specifically on science, logic, and mathematics rather than art or whatever else the committee protocol calls human intervention. It is absolutely archaic in the day of big data to ignore analytical models in favor of subjective comparisons. Do the coaches, atheletic directors, and politicians (e.g., Condoleezza Rice is on the committee but has virtually no “football experience” in her background) that make up the football committee understand the value of algorithms? I am not sure, but there is a wealth of research that says they should.
From my experience on football boards and chat rooms, nothing gets a fan’s dander up more than claiming computer models are unbiased. But they are. They start with only formulas melded together into computer algorithms. And the algorithms are based on sound mathematical principles and proofs. There are many college football algorithms used in computer ranking models and many of them are considered proprietary. More than 60 are compiled on www.mratings.com. The math can get pretty intense, but if you are interested in the details of the known algorithms, I recommend the book Who’s #1?: The Science of Rating and Ranking by Amy N. Langville at the College of Charleston and Carl Meyer at North Carolina State University4. The people that do these algorithms are steeped in mathematical prowess. For example, the Colley matrix was done by Wes Colley after he completed his PhD at Princeton University in astrophysics. Although the math can get tricky, the principle is rather simple. The algorithms typically involve matrices and vectors that simultaneously consider not only which team beat which opponents but which teams the opponents beat, and which teams those opponents beat out into n dimensions. In addition, difficulty of schedule and score differentials can also be incorporated into the algorithms. When we watch college football we get a sense of which team is best by comparing how each team plays against its opponents. But such opinions are hopelessly mired in the biases and are enhanced by the fact that preseason polls skew our perceptions before the season begins. The algorithms do precisely what human perception is trying to do but without any biases and simultaneously with a huge array of data 5.
I don’t understand the reluctance of the powers to be in college football to incorporate mathematical equations into the playoff system. These types of algorithms permeate the business community. Google’s PageRank ranks web pages using some of the same algorithms as computer models do to rank teams. Although it is a carefully guarded secret, Langville and Meyer 6 concluded, based on patent documents, that Google’s algorithm uses the Perron-Frobenius theorem which is also used by James Keener in his football rankings 7. The BellKor company won a Netflix prize of 1 million dollars for writing an algorithm that was 10% better than the one created by Netflix. Every time Netflix suggests a movie, it is exploiting the same kinds of algorithms used in football rankings. In fact, Langville and Meyer applied the algorithms behind the Colley and Massey methods to the Netflix movie ratings database and came up with a list of the top movies in their book (pages 25-27). No one complains about page ranks or movie suggestions being too nuanced in rigor. Can you imagine a committee trying to ascertain page ranks? No one promotes the “eye test” to rank web pages even though the eye test is commonly prescribed as the only legitimate way to determine which teams are the best in college football. Isn’t it obvious that this is about control rather than human abilities versus computer algorithms?
Deep data has been integrated into almost all sports. Witness the way professional baseball has dispensed with the traditional positions on the field in favor of moving players to positions where the hitter is most likely to hit. It is not unusual to see a shortstop in shallow center. The game was primarily changed when computers had the computing power to handle the large amounts of data that could be collected. Read Moneyball by David Lewis 8 to see how manager Billy Beane used statistics (now called sabermetrics) to take a struggling Oakland Atheletics team to the playoffs. Opinions of seasoned professional scouts that relied on the eye test to recruit talent have gone the way of the dodo bird.
In my opinion, nothing seems more egregious in the polls than the way teams are punished for losing when they play difficult schedules and other teams are favored for winning even with cupcake schedules. Let’s pretend we can determine the thirteen best teams in college football before the season and the number 13 team has scheduled all the top twelve teams during the regular season. The number 13 team could finish the season 0-12. The AP and Coaches polls would be extremely hard on the team and they would never rank the team in the top 25 even though we know by definition they are the 13th best team in the nation. But the computer algorithms would recognize the logic behind the difficult schedule and although they might not rank them 13th, they would probably have a good showing. The counter to this example is a team with a fluff schedule. The polls are notorious for ranking teams with perfect records higher than is sometimes justified when strength of schedule is considered. In theory, any team in the FBS could win all their games if they played lesser ranked opponents on their schedule. Fortunately it appears that the playoff selection committee has recognized that strength of schedule is an important factor and they do consider it. However, the committee’s willingness to consider head-to-head games seems logically misplaced. Let’s go back to our top 13 ranked teams again. If the number four team lost to the number 5 team and the number 5 team lost to the number 13 team, the committee would indubitably place the number 5 team into the playoffs over the number 4 team based on the silly head-to-head rule even though the computer algorithms would recognize the problem and consider the entire schedule of each team.
Although we don’t like to admit it, statistically improbable events can have a huge impact on single games which may never be noticed by the committee (or the computer algorithms for that matter – see the section on betting below). If anyone saw the national championship last year you could not be faulted for thinking that Clemson may have been the best team in the country even though they lost to Alabama (it hurts me to say this because I am an alumnus of Alabama and a huge Crimson Tide fan – I go way back to the Bear). Alabama had an onside kick that they recovered. It appeared to change the momentum of the game and yet, the probability of that onside kick being perfectly placed seems unlikely. Watch it for yourself below. Bama also needed a kickoff return and a few turnovers on their way to a 45-40 national championship victory. The point being that minutiae that would otherwise not have a big impact can and does play a role. It is the butterfly effect which teaches us that there is no right answer when it comes to rankings. The best we can do is create an unbiased mathematical system rooted in statistics and deep data with as little input as possible from naturally biased humans.
Last year I set out to test the college football computer algorithms by setting up a spreadsheet which monitored theoretical bets of $100 on each of the college games beginning on November 8 through the college bowl games. I waited until late in the season because, in theory, the algorithms work better with more data. I used Sagarin‘s predictor ranking which includes score differentials and home-team advantage. First a few words about these items. It is true that teams can run up the score although it rarely happens on a consistent basis. But most algorithms correct for large score differentials9 to avoid any advantages gained in the rankings from running up scores. Home-team advantage is an interesting subject in itself and is usually attributed to psychological effects of playing in a stadium full of the home-team fans. But these effects are difficult to test. The subject has also been addressed in the scientific literature, and much to my surprise, some studies show that referees can be influenced by the home crowd. For example, Harvard professor Ryan Boyko and his colleagues found that statistically referees favored the home team in 5,244 English Premier League soccer matches over the 1992 to 2006 seasons10. Regardless of the reasons for the effect of home-field advantage, algorithms can correct for it. Sagarin calculates a score to be added to the home team when betting.
The results of my theoretically betting are shown below for each week (the bowl season caused the number of games to vary in December). Had I bet $100 on each of the 287 games monitored I would have lost $700. So what’s so terrific about a ranking system that loses money in Vegas? It is simple – point spread. If Vegas lost money on college football games, there would be no betting. It is common for the media to give point spreads in games as a reflection of who Vegas thinks will win the game. But spreads are not about who is favored, the spreads are about enticing bettors to bet. With a point spread, Vegas does not have to predict winners, all they need to do is entice bettors by making the point spread seem to favor one side or the other. Vegas knows how to make money on all those built-in biases we have. They collect a fee (called a vig or juice) for handling the bet, and as long as they have about the same number of losers and winners, they take home a tidy profit. To make sure the winners and losers are equal, they shift the spread during the course of the week as the bets are placed assuring that the same amount of bettors are on both sides of the spread. Even the computer algorithms can’t beat the crafty Vegas’ bookies. Even though the computer algorithms are very good at predicting winners (near 60%), no algorithm (or, for that matter, any human) can beat spreads on a consistent basis11. But people keep trying.
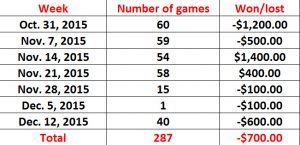 Amount of money theoretically lost using Sagarin rankings.
Langville and Meyer point to two reasons why computer algorithms don’t beat point spreads; 1) The computer algorithms are created to predict rankings not score differentials. In the computations, they ignore important scoring factors such as strength of defensive backfields against high-octane passing attacks which might create lopsided scores even though the rankings rate both teams average. Then there are always the statistical flukes that occur in games as mentioned above which cannot be predicted. 2) Spreads are also difficult to predict particularly in football because points are tabulated in sets of usually 3, 6 or 7. Therefore, games tend to be multiples of these numbers rather than simple evenly distributed numbers.
I must conclude from the data that the only way to select the four teams that play at the end of the year in college football is to use computer algorithms. There should still be a committee that decides how to weigh such things as league championships. It will also be extremely important to make sure that the algorithms used are completely understood by the committee (no black-box proprietary claims). The algorithms need to be analyzed to determine which equations and factors give the most meaningful results and changed accordingly. Score differentials should be included within the algorithm after they have been corrected for the potential of teams running up the scores.
Appendix – a brief overview of linear algebra and rankings
There is no way in an essay I can do justice to the subject. But I did want to emphasize how these equations eliminate any bias or human influence. I highly recommend the Khan Academy if you want a brief overview of linear algebra.
Rather than use my own example, I have decided to use the data presented by Langville and Meyer because it is easier to understand when every team in the example has played every other team in the division. The data shown below comes from the 2005 Atlantic Coast Conference games.
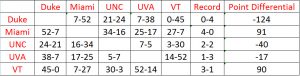 The 2005 data from the Atlantic Coast Conference
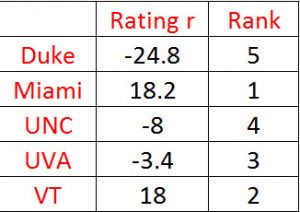
The Massey method of ranking teams was developed by Kenneth Massey for his honor’s thesis in mathematics while he was an undergraduate at Bluefield College in 1997. He is currently an assistant professor at Carson Newman University. Using his equations, the table above can be converted into a linear algebra equation of the form Mr = p where M is the matrix containing information about which teams played which other teams, r is the rating factor (which is equated to the ranking), and p is the sum of each team’s score differentials:
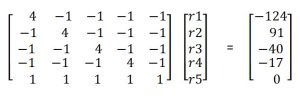
Note the diagonals of M are the games played and each -1 in the matrix shows that each team played every other team. The last row is a trick Massey used to force the ranks to sum to 0. The solution is calculated by inverting the matrix M and multiplying times p to obtain the following results 12:
- Kahneman, D. (2011) Thinking, Fast and Slow: Farrar, Straus and Giroux. ↩
- Loftus, E. and Ketcham, K. (1994) The Myth of Repressed Memories: False Memories and Allegations of Sexual Abuse: St. Martin’s Press ↩
- Paul, R. J., Weinbach, A. P., and Coate, P. (2007) Expectations and voting in the NCAA football polls: The wisdom of point spread markets: J. Sports Economics, 8, 412 ↩
- Langville, A.N. and Meyer, C. (2012) Who’s #1?: The Science of Rating and Ranking: Princeton University Press ↩
- I would like to thank Amy Langville for suggested changes here ↩
- see ref. 4 ↩
- Keener, J. (1993) The Perron-Frobenius theorem and the ranking of football teams: Society for Industrial and Applied Mathematics, 35, 80 ↩
- Lewis, D. (2003) Moneyball: W. W. Norton & Company ↩
- see ref. 4 ↩
- Boyko et al. (2007) Referee bias contributes to home advantage in English Premiership football: Journal of Sports Sciences, 25, 1185 ↩
- see ref. 4 ↩
- see ref. 4 for details ↩