
Disinformation has become a hallmark of companies and religious sects interested in undermining science. Please note that I have used disinformation instead of misinformation because these organizations have purposefully spread wrong or bad information to mislead the public and cloud issues discovered by science. The most famous example comes from the tobacco industry. Richard Kluger’s book Ashes to Ashes1 won the Pulitzer prize and helped expose the ruse that nicotine is not harmful or addictive. The tobacco industry funded hundreds of scientific research projects in an attempt to muddy the waters concerning the health risks of smoking. Who will ever forget the seven CEOs of America’s largest tobacco companies swearing in front of Congress in 1994 that nicotine is not addictive (still on Youtube if you care to reminisce). One of the leading examples of the travesty was the funding of the Harvard Center for Tobacco Research. Big Tobacco, through its Council for Tobacco Research, gave millions of dollars to the Center and Dr. Gary Huber2
In a more recent exposé, Mark Fainaru-Wada and Steve Fainaru showed in their book League of Denial how the National Football League actively downplayed the seriousness of trauma to the head3. For example, to offset concern over head injuries, the NFL and commissioner Paul Tagliabue set up the Mild Traumatic Brain Injury Committee (MTBI) in 1994. The committee was notorious for denying that concussions did not lead to serious effects. In 2003, the committee began publishing what would amount to 16 research papers in the coopted science journal Neurosurgery, supporting their contention that the concussion problem was minor. It certainly helped that the Neurosurgery editor, Michael L. J. Apuzzo, was a major NFL fan4. The MTBI fuzzy logic included statements such as: “A total of 92% of concussed players returned to practice in less than seven days … More than one-half of the players returned to play within one day, and symptoms resolved in a short time in the vast majority of cases.” During the same period independent research was discovering chronic traumatic encephalopathy (CTE) in the brains of deceased football players that had suffered numerous concussions throughout their careers.
Then there is the whole creationist movement which has attempted to undermine science through such organizations as the Institute for Creation Research. There is neither space nor time to delve into the movement’s attempts to promote creationism and more recently intelligent design. If you want to read a riveting account of one of the recent battle fronts pick up a copy of Monkey Girl by Edward Humes5. It documents the attempt by the Dover School Board to demand the teaching of intelligent design in science classes which resulted in Kitzmiller v. Dover Area School District legal brouhaha.
Does this sound familiar? Exxon (now ExxonMobile) formed the Global Climate Coalition in the 1980s to lobby congress and actively dispute the claim that global warming was not caused by anthropic greenhouse gases6. The organization shut down in 2001 under pressure from numerous groups, but by then, the term global warming had morphed into a political issue entrenched in right-wing politics. But the time may be coming for ExxonMobile to pay up for its disinformation campaign. More than a dozen state attorney generals are investigating ExxonMobile for attempting to obfuscate the facts about global warming. The New York Times reported in March that new documents published by the activist group Center for International Environmental Law shows that Exxon knew about the dangers of global warming from carbon dioxide through its own research as far back as 1957 and established a campaign that doggedly fought air pollution control.
Admittedly, politics always baffles me. The science of global warming via anthropic greenhouse gases seems so obvious that I have trouble seeing how the issue could become such a heated-cantankerous argument. Let me briefly outline the science and you decide. I have no ax to grind in the debate. I tend to favor middle of the road solutions. What I am more interested in is how the issue could ever become hijacked by politics. If you are the kind of person whose eyes glaze over when you see graphs, hang in there because it is all pretty straight forward. Before we dig in, let me remind you of a phrase Thomas Henry Huxley, known as Darwin’s bulldog, said: “My business is to teach my aspirations to conform themselves to fact, not to try and make facts harmonize with my aspirations… Sit down before fact as a little child, be prepared to give up every preconceived notion, follow humbly wherever and to whatever abysses nature leads, or you shall learn nothing.”
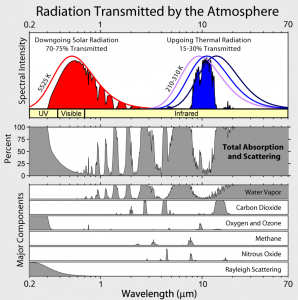
Wavelength is plotted below on the x-axis (which is broken down into UV, visible, and infrared radiation) and the spectral intensity is plotted on the y-axis. The red curve (top panel) represents the span of wavelengths transmitted by the sun and received at the top of the earth’s atmosphere. Scientists refer to the electromagnetic radiation that comes from the sun as Planck black body radiation because they can reproduce it by heating an opaque non-reflective body (a black body) to a temperature of 5,525 degrees Kelvin. The red region represents the extent of radiation that is received at the earth’s surface (i.e., not absorbed). Note that most of the UV radiation is absorbed by the atmosphere (mostly due to the ozone layer fortunately) and most of the visible spectrum gets through. Animals have evolved to “see” in the visible spectrum almost certainly because light comes to us in this range of the spectrum.
 Global Warming Art, Wikipedia
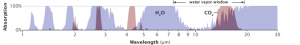
The average Planck black body radiation of the earth is represented by the blue curve (255 degrees Kelvin)7 The blue area filled in under the blue curve is the amount of radiation from the earth that escapes into space (emitted by the top of the atmosphere) which is equal to about 15 to 30% transmission. Virtually all of the near to far infrared is absorbed by greenhouse gasses shown in the panels in the above diagram for each of the gases. Water plays the biggest role but carbon dioxide has an impact on the far infrared. You can see this better in the diagram below.
 NASA
NASA
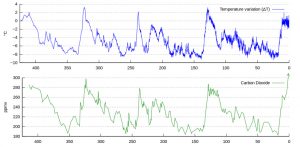
Relatively small increases in carbon dioxide have a profound affect on the absorption of radiation (energy). In fact, it is so sensitive that carbon dioxide closely follows the temperature changes during the past glacial cycles — the last 420,000 years are shown below. As you can see, we are in an interglacial warming period and, under normal nonanthropic conditions would expect to enter another ice age in about 10,000 years8. I should mention that carbon dioxide concentrations were measured from Vostock ice cores taken from Antarctica (the ice traps air bubbles locking in atmospheric concentrations). Temperatures in the same cores were determined from hydrogen and oxygen isotopes9 10.
 NASA/NOAA
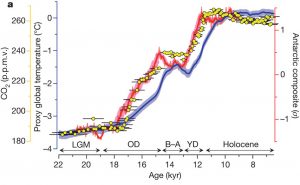
Now here is one of the most astounding graphs in environmental science – carbon dioxide and temperature over about the last 20,000 years11. It shows global temperature in the blue curve relative to the Holocene mean between 6.5 and 11.5 thousand years ago (LGM is the last glacial maximum). The red curve is an Antarctic composite core temperature profile. Carbon dioxide concentrations (yellow dots) start to rise as we come out of the last glacial cycle along with temperature about 18,000 years ago and continue to rise until about 8,000 years ago when they become stable (temperature – red curve – and carbon dioxide in the cores lag a bit behind global temperature – blue curve). Note that carbon dioxide concentrations have stabilized at about 260 ppm (parts per million) over the last 8,000 years or more (the current carbon dioxide changes are too new to be picked up in the cores).
 Shakun et al., 2012
Compare the graphs above to the carbon dioxide data measured directly from Hawaii since 1957 below. The concentrations went above 400 ppm in 2015 (the annual variations are due to higher output in carbon dioxide by vegetation during the summer in the northern hemisphere – more land in the north), 140 ppm over the average of the last 8,000 years shown in the above diagram. It is important to point out that carbon dioxide concentrations have not reached this level in more than 3 million years12!

And here is why scientists think that humans are responsible for most of the carbon dioxide increase. The graph is of temperature from 1880 (annual mean compared to the average between 1951 to 1980). The red line is a five-year running average. Temperature begins to increase significantly when carbon dioxide concentrations reach about 340 ppm in the mid 1970s. The Intergovernmental Panel on Climate Change won the Nobel Peace Prize in 2007 and consists of thousands of the world’s finest scientific minds contributing to their reports. The IPCC Fifth Assessment Report which was completed in 2014, stated: “It is extremely likely [90 to 100% probability in their words] that human influence has been the dominant cause of observed warming since 1950, with the level of confidence having increased since the fourth report”.
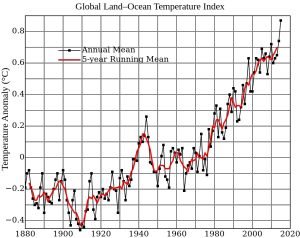 NASA
NASA
So why all the fuss? Even if we admit that carbon dioxide and global temperatures are rising (and they are also rising in the ocean because carbon dioxide and heat are absorbed from the atmosphere), is this devastating for the future of the world? To be honest, no one knows for sure. I could list a plethora of examples of the impact from these changes – sea level rise, species habitats being pushed toward higher latitudes or higher elevations worldwide, ocean acidity, continued melting of the world’s glaciers, etc. But the data that keeps me up at night (being overly dramatic here) is the tipping point. Climate models show global temperatures rising between 1 to 2.5 degrees centigrade (1.8 to 4.5 degrees F) between 2050 and 2100. We don’t know what might throw us into a tipping point – what Wagner and Weitzman call “tail effects” or “black swans” to designate statically low probability extreme events13. They are referred to as tail events because they occur on the ends of a bell distribution curve (less than 2.1% in the figure below – greater than 2 standard deviations). These events will be so potentially horrendous that we may not know how to combat them.
Wagner and Weitzman claim that tail events are “profound earth-as-we-know-it-altering changes”. For example, they may lead to as much as a 30 percent decline in global economic output. No one knows. The only thing that is certain is that if we continue to ignore global warming and its effects, we are taking huge potential risks.
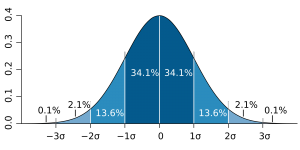 Wikipedia
- Kluger, R. (1996) Ashes to Ashes: America’s Hundred-Year Cigarette War, the Public Health, and the Unabashed Triumph of Philip Morris: Vintage ↩
- McGarity, T. O. and Wagner, W. E. (2012) Bending Science: How Special Interests Corrupt Public Health Research: Harvard University Press ↩
- Fainaru-Wada, M. and Fainaru, S. (2013) League of Denial: Three Rivers Press ↩
- Fainaru-Wada and Fainaru suggest that Apuzzo was drawn to the limelight of the NFL as the major reason for allowing dubious papers to be published by the MTBI ↩
- Humes, E. (2007) Monkey Girl: HarperCollins Publishers ↩
- The CCC was a major opponent to the Kyoto Protocol and was instrumental in persuading the US not to sign it ↩
- The black curve is the upper atmosphere at 210 degrees Kelvin and the purple curve is the lower atmosphere near the earth’s surface at 310 degrees Kelvin. ↩
- Novacek, M. (2007) Terra: Our 100-Million-Year-Old Ecosystem — and the Threats That Now Put It at Risk: Farrar, Straus and Giroux ↩
- The ratio of hydrogen isotopes has a linear relationship with temperature. The hydrogen isotope (hydrogen has one electron and deuterium has 2 electrons) is lighter than deuterium and preferentially evaporates relative to deuterium from seawater (it takes less energy to evaporate a water molecule with hydrogen than a molecule with deuterium). In periods of high temperature, more water evaporates concentrating deuterium in seawater relative to the atmosphere. The relationship between hydrogen and deuterium in the atmosphere is recorded in snow as it falls and becomes part of the glacier sampled. Temperatures are extrapolated from the ratio of the isotopes of hydrogen. Oxygen isotopes are used in a similar way to augment the hydrogen isotopes. ↩
- Petit, J. R., et al. (1999) Climate and atmospheric history of the past 420,000 years from the Vostok ice core Antarctica: Nature, 399, 429-436 ↩
- Shakun, J. D., et al. (2012) Global warming preceded by increasing carbon dioxide concentrations during the last glaciation: Nature, 484, 49-54 ↩
- Nordhaus, W. D. (2015) A new solution: the climate club: New York Review of Books, June 4 ↩
- Wagner, G. and Weitzman, M. L. (2015) Climate Shock: The Economic Consequences of a Hotter Planet: Princeton University Press ↩