The term fracking conjures up so many knee-jerk-bad reactions that I am hesitant to broach the subject.   I suppose if I am going to wade into the topic I should give some bona fides to display my knowledge of the petroleum industry, but not too many bona fides so that I might be seen as a talking wonk for the gas industry.  I worked for one year as an engineer for a well service company called Schlumberger (world’s largest) and two as a geologist with Shell Oil.   Shell gave its geologists full responsibility for drilling a well from the time it was proposed to production if it hit oil.  Of the 11 wells I proposed, 3 hit oil which was above the industry standard in producing fields in the late 1970s and early 1980s.  Eventually I realized my calling was in teaching and research and left to go back to school for my PhD.  But not before I got a pretty good idea of how the industry works.

The process of drilling is not complicated although the devil can be in the details.  A rig contains strings of thirty-foot drill pipe which attach to a tri-cone tungsten carbide bit (see the image below).  The bit spins from drives or motors as drilling fluid, called mud (contents vary but clay, water and lubricants are typical), is pumped through the pipe string to keep the bit cool, increase pressure, and bring the rock debris from drilling back to the surface along the outside of the pipe.  One of the technological marvels developed in modern times is the ability to direct the drill bit to specific locations with pin-point accuracy by knowing where the bit is in three-dimensional space usually thousands of feet below the surface.  Directional survey measurements are complex but are based on measurements while drilling through various instruments.  These advances have enabled horizontal drilling which has become important in fracking.
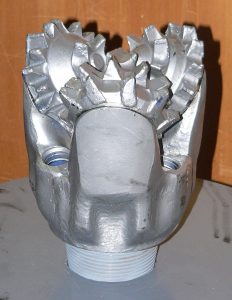
800px-Tete-de-foreuse-p1010272Rama, Wikipedia

I would be remiss not to emphasize the importance given to protecting the water table when drilling.  State and Federal regulations require the well to be sealed off at least 50 feet below where potable groundwater can be produced, and those laws have been in place as far back as anyone can remember.  The drill pipe is tripped (pulled completely out of the hole) when regulators deem the surface casing should be set to protect the water table (something on the order of 500 feet usually).  The casing is cemented in place, and if it is done correctly,  we know from the drilling of hundreds of thousands of wells over many decades that the water table is protected.  After the surface casing is set, drilling is continued until the target zone is reached.  The pipe is tripped again and the entire well is generally set with cemented production casing.  The hole is plugged at the bottom usually up to 50 feet below the horizon of interest.  The casing is perforated by tools that blow holes in it precisely where the rock containing oil and/or gas exists.  Lisa Margonelli has written an excellent book entitled Oil On the Brain about the details of drilling and its impact on the politics of many countries like Nigeria and Venezuela1.

When I worked for Schlumberger, it was my job to determine if production casing should be set by running tools in the hole.   The measurements produced records called well logs that gave us information about not only the rock below but whether it contained producible oil or not.  Drilling is a chancy business, not for the faint of heart.  Most wells never produce a drop of oil.  I have seen many an owner of a wildcat well near tears as he realized from the logs that the well was a “duster”.  That has changed to a great extent in the new-world order of gas and oil production through fracking.  The new targets — usually oil shales — were discovered decades ago by previous drilling.  They were ignored because shales do not naturally flow under the pressures at depth.  Shale is very porous but not permeable.  You need permeable rocks to produce oil and/or gas, or so it was thought.

That was before Mitchell Energy, a midsized exploration and production company, drilled the S. H. Griffin #4 well in North Texas into the oil- and gas-rich Barnett Shale in 1997.  They used fracking techniques to produce large quantities of methane gas from what was traditionally seen as non-producible rock.  If you are interested in more of the details, read Gary Sernovitz’s immensely entertaining and witty book The Green and the Black2.  Sernovitz, even with ties to the petroleum industry, takes a rather neutral approach to adjudicate the brouhaha over fracking.  One of the highlights of the book is his look at the impacts of the new United States gas and oil reserves on the political and economic scene.

The S. H. Griffin #4 not only produced gas, it produced it in steady quantities (1.5 million cubic feet per day).  So how does fracking make an otherwise impermeable rock produce as if it was a well at the height of the oil boom of the 1960s in the United States?  Fracking sounds ominous and sinister and conjures up visions of rock being fractured all the way to potable water zones.   But it is nothing of the sort — pure fiction.  The technique took decades of testing and experimentation in wells to develop.  The secret is hydraulic pressure from fluids injected into the well to cause the shale to fracture.  The fracturing is usually limited to about 300 feet in an outward radius around the drill hole.  And don’t forget, the drill holes typically go down for thousands of feet below the surface and are protected with cemented casing that has only been perforated in small sections usually at the bottom of the hole where the target rock exists.

It did not take companies long after fracking became successful to incorporate horizontal drilling, another United States technological advance, into the new smorgasbord of production proficiencies.  With the ability to target a bit within inches of a desired location, drillers learned how to gradually arc a pipe into the horizontal (see image below).   The technology turned out to be a bonanza when combined with fracking.  Companies drilled and set casing directly within and parallel to the oil shales enabling them to frack large sections of the rock which sent production through the ceiling.
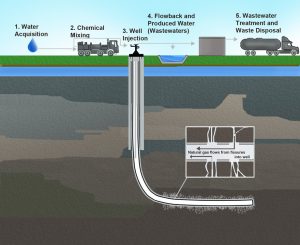
Hydraulic_Fracturing-Related_ActivitiesEPA

The chemicals used in fracking were originally a trade secret, but people talk, and once the word was out, companies like Halliburton published the composition of their fracking liquids.  Turns out 90 percent of the frack is made up of water, 9.5 percent consists of a proppant which is usually sand, and only 0.5 percent consists of the scary chemicals often used to undermine the industry.  The sand serves as a support to keep the fractures (caused by the pressurized fluid) propped open so gas and/or oil will flow.  I am not going to pull punches here.  It takes a lot of water to frack a well.  Sernovitz estimates that a typical frack (an average of 22 stages) uses between 4 and 8 million gallons of water and about 6 million pounds of sand.  Unfortunately, not all of the fracking fluid stays in the hole.  Some resurfaces.  Today the water that comes back is reused or disposed of by pumping it into former producing fields in a concerted effort to make sure the chemicals within the water (even if they are only 0.5%) are placed out of harms way.

It has been widely reported that fracking causes earthquakes.  Actually the disposal of water being pumped into the ground (usually from fracking) causes the seismic activity.  Perhaps it seems like a trivial difference, but the public seems to have the idea that the pressure from fracking is so great that it directly causes earthquakes.  The typical increase in seismic activity in a state like Oklahoma is usually effectively mitigated by diverting the injection of water from fields responsible for the activity or requiring the water to be disposed of via other methods.  There can be little doubt that the earthquakes are associated with well injection and regulatory commissions need to fully address the problems.

The HBO premier of Gasland, a 2010 documentary about the natural-gas industry in general and fracking in particular, was probably responsible, at least in part, for New York State banning fracking and a great deal of misunderstanding about natural gas and its impact on the environment.   I have two conflicting opinions about the documentary by Josh Fox.  1) It is clearly tarnished with misrepresented science, almost hysterical overreaction, and historical inaccuracies.  The documentary has been thoroughly taken to task by Energy in Depth.  2) Having said that, there is no question that it is emotionally moving.  It was difficult to watch people whose lives have been impacted badly by the failures of the gas industry.  My conclusion — Gasland was necessary to open a national debate about the issue which has led to more government oversight and less rogue shortcuts leading to serious problems.  However although there will always be problems associated with any industry, drilling for natural gas and/or oil on land in the United States is relatively safe to groundwater.  We simply have to make sure that casing practices are properly implemented.  Water taps catching fire in Dimock, Pennsylvania, happened because of sloppy cement work and poor casing in 27 holes during the early days of drilling in the State (gas leaked through the casing into the surrounding water table).   I find it reprehensible that companies would not protect the water table at all costs and fully agree that the companies cited deserve the penalties they received and payouts they had to make to people they injured.

Finally, I need to emphasize that in 2015 the Environmental Protection Agency (EPA) did a summary paper entitled Assessment of the potential impacts of hydraulic fracturing for oil and gas on drinking water resources and concluded that “Assessment shows hydraulic fracturing activities have not led to widespread, systemic impacts to drinking water resources”.  We can conclude that the gas industry has made mistakes, but we cannot contend that our drinking water is in danger because of fracking despite claims to the contrary in sources like Gasland.

Let’s not forget why Fox started filming the documentary – to protect his vacation home in a pristine part of Pennsylvania near the border with New York.  I get it.  No one wants a drill rig in their back yard even if it is only there for 40-days worth of drilling.  By the way, if you want to read a reasoned and enlightening book about how people are affected adversely by drilling, I recommend Seamus McGraw’s The End of Country: Dispatches from the Frack Zone3.  He weighs the potentially bad impacts of drilling with a healthy dose of understanding that gas and oil companies are filling a demand created by the United States and other world consumers.   Unfortunately, Fox never examines the financial impacts of shutting down the fracking industry.

I recently wrote an article on the serious implications of global warming particularly related to the increase of athropogenic gases in our atmosphere.  Of the three major fossil fuels, coal is, by far, the worst polluter of carbon dioxide followed by petroleum.  Natural gas is the least (see figure below showing the effects of anthropogenic gases as radiative forcing).  In fact, Sernovitz has emphasized that “the United States has led the world in carbon dioxide emissions reduction because of shale gas [use of methane gas instead of coal]”.

gases

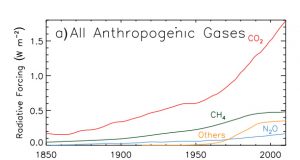
IPCC Fifth Assessment Report 2013

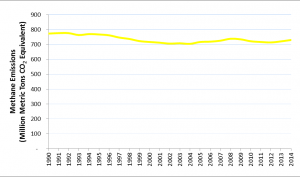
It would be unfair not to point out that methane leaks into the atmosphere directly from the production of methane gas contributing to anthropogenic gases (as methane) also, but according to the EPA in a report entitled Overview of Greenhouse Gases: “Methane (CH4) emissions in the United States decreased by 6% between 1990 and 2014.”  During the period from 2007 to 2014, natural gas production was increased tenfold according to the US Energy Information Administration database.   The EPA goes on to comment that “During this time period [1990 to 2014], emissions increased from sources associated with agricultural activities, while emissions decreased from sources associated with the exploration and production of natural gas and petroleum products.”   Note the lack of effect from the natural gas boom between 2007 to 2014 in the graph below showing total United States methane emissions (converted to carbon dioxide equivalents).   In a paper funded by the green-friendly Environmental Defense Fund (EDF) and published in the Proceedings of the National Academy of Science, Allen et. al4 estimated from measuring 190 onshore gas locations that about 0.42 percent of the methane produced leaks from drilling and completion of the wells.   The EPA is working with the gas companies to further reduce this figure but, once again, it is hardly having the impact sources such as Gasland have portrayed.

USMethaneEmissionsTimeSeriesEPA

The oil production in thousands of barrels per day since 1966 from the top ten oil producing countries (as of 2015) is shown in the diagram below.  One of the most startling aspects of the graph is that the United States has become the World’s largest producer of oil.  It’s not Saudia Arabia or Russia, it’s the United States.  What is even more remarkable is that our world lead came through good old fashion American know how — the technology that enabled the United States’ producers to frack horizontally.   I am no flag waver, but there is no denying how the United States has transformed itself.  The halcyon days of the 1960s when the United States led production worldwide were thought to be gone forever (see figure).  By the early 1980s, even secondary recovery processes in declining oil fields could not up American production.   Our decline in oil production continued until about 2005 when fracking began to be felt.  The dramatic impact of that technology can be seen by the subsequent rise in production for the last 10 years in the graph below.  However, our increased production does not meet our ever-increasing demand, but it not only helps our trade deficit but decreases our dependence on oil from the troubled Middle East and a hostile Russia.  Along with the increase in oil production, we have also become the world’s leader in the production of natural gas (don’t forget that both oil and natural gas have less impact on climate change than coal).

kbdData from BP

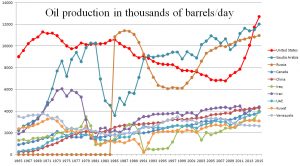
I asked Gary Sernovitz what he thought about America’s new role as a leading oil and natural gas producer: “One of the strange things about the gas boom is that even as prices have gone down, and activity has gone down (because of low prices), volumes have still gone up—a credit to how productive have been [sic] the wells in the Northeast US.  This year [2016] gas production is down slightly, but we’re still producing 34% more than the Russians so no risk of losing our crown. 2015 was the year that we exceeded Saudi Arabia in total oil production, and became the world’s largest oil producer. We’ve temporarily lost that crown in 2016, but I’d expect [our] prices to recover for that leadership to happen again soon.  And I do think we’re still by far the largest oil and gas producer, despite the dip in oil production because of prices, as we’re far ahead of Russia on oil now too.”

So I would like to summarize the article by stating categorically that we need to curb anthropogenic gasses (carbon dioxide, methane, etc.).  But attempting to shut down the oil and gas industry in the United States because of fracking and/or to solve the climate change problem is like trying to take out a drug cartel to stop drug usage in the United States.  The only way we are going to reduce our dependency on oil and gas is to reduce the increasing need for it.  Fracking is relatively safe to the consumer and looks to be giving America another chance to remain less dependent on other suppliers while we find alternative sources to replace or at least curb America’s craving for energy.

  1. Margonelli, L. (2007) Oil on the Brian: Adventures from the Pump to the Pipeline: Doubleday
  2. Sernovitz, G. (2016) The Green and the Black: The Complete Story of the Shale Revolution, the Fight over Fracking, and the Future Energy: St. Martin’s Press
  3. McGraw, S. (2011) The End of Country: Dispatches from the Frack Zone: Random House
  4. Allen, D. T. et. al (2013) Measurements of methane emissions at natural gas production sites in the United States: Proceedings of the Natl. Acad. Science: 110, 17768–17773

A few lucky souls have stumbled on diamonds in glacial debris around the Great Lakes and further north into Canada for centuries.  Geologists have known that the sources of those diamonds represented a vast wealth of hidden treasure somewhere in the frozen tundra of northern Canada, but it was not until the late 1980s that a couple of cowboy geologists, Chuck Fipke and Stewart Blusson, painstakingly ferreted their way back to the source. But I am getting way ahead of the story.

Diamonds are brought to the surface from deep within the upper mantle via unusual igneous rocks called kimberlites (and sometimes lamproites).   I recognize I run the risk of losing my readers by delving into the nature of kimberlites, but to a geologist like myself kimberlites are crazy types of rocks.  Typical magmas (and lavas) like basalt form by partial melting of the mantle.  Kimberlites, on the other hand, are geologically unique because although they form from partial melting of the mantle, the melting is significant enough for these rocks to resemble compositionally (not precisely) the mantle itself.  They are referred to as ultramafic rocks as compared with basalts which are mafic (mafic means rich in magnesium and iron – two of the most abundant elements in the mantle).

Diamonds actually don’t form in kimberlites.  Think of kimberlites as a conveyor belt bringing diamonds that form under high temperatures and pressures (from about 125 to 175 kilometers1) to the surface relatively fast, before they can reequilibrate (breakdown) into other compounds like graphite or carbon dioxide.  Diamonds are not forever.  Many an exploration program has had its hopes dashed with the discovery of kimberlite full of octahedral or other cubic forms of graphite — degraded diamonds2.

Exploration for diamonds can be excruciatingly frustrating.  There are 6,400 known kimberlite pipes worldwide but only 30 or so have become viable mines — that’s about 0.5% chance that a discovered kimberlite will turn into a producing mine.  It’s true, diamondniferous kimberlites are hard to find, but you don’t need many diamonds to make a mine.  High-grade diamond kimberlites only contain a few carats per ton of rock.  That’s enough to make any geologist rich beyond her dreams.  Kimberlites form at greater than 200 kilometer depths (200 to 600 km) and are enriched in volatiles (e.g., carbon dioxide and water) that make the magmas not only buoyant but explosive.  They literally “blow” through the upper mantle and crust in perhaps a matter of hours (rates postulated are about 14 km/hr) forming carrot-shaped pipes called diatremes (see the diagram below).  The faster the better for diamond preservation.  But they also have to pick diamonds up along the way or incorporate them as the magma forms.  Kimberlites can contain as much as 25 to 50 percent rock within their magma acting as an elevator to the surface for mantle material helping geologists understand the mantle3.

VolcanicPipeAsbestos Wikipedia

After half a century or more of serious diamond exploration. we have learned that diamond-bearing kimberlites form below the cratons.  The cratons are the ancient regions of continents containing rocks greater than 2 billion years old.  There is still great debate about how the cratons formed, but every continent is rooted in these ancient environs.   If you are looking for diamonds, go to the cratons.  Before the 1980s, diamond kimberlite mines had been developed on every craton of all the continents except Antarctica and North America.  Diamonds come from two major sources: mantle rock (e.g., peridotite) and eclogite (metamorphosed basalt).  Diamond formation in peridotites occurred primarily in the Archean centered on a time about 3 to 3.3 billion years ago but some dates are as young as 1.9 billion years ago.  Eclogite diamonds tend to be younger from 1 to 2.9 billion years ago.

Where does the carbon come from to form diamonds?  No one knows for sure, but most researchers think that the carbon along with sediments and volatiles were subducted through plate tectonics (the ecologites brought up by kimberlites are likely ancient subducted ocean floor)4.  I am interested, through my own research, on how the cratons formed and when subduction began.  Many geologists pooh-pooh the idea that subduction could have begun so early in earth history so it is satisfying to see how diamond research supports the early existence of plate tectonics and subduction.  My colleagues and I have contended for years that the cratons are the result of ancient subduction.

Imagine Chuck Fipke in the 1980s looking out over the vast expanses of northern Canada contemplating all the diamonds he believed had to be out there in the craton hidden below tons of glacial deposits.  Those damnable glacial deposits were the reason no one had discovered pipes in Canada5.  The map below shows the furthest extent of the glaciers 17,000 years ago and the site of the diamond pipes eventually discovered.  Fipke also had to contend with De Beers, the giant cartel that controlled the world’s diamond markets. They were actively exploring with their practically unlimited resources.  I worked for De Beers as a consulting geologist for a time in the mid 1990s in Russia, and I can assure you, they are a force to be reckoned with.

diamond countryBase map from Wikipeida

By the mid 1980s, geologists had discovered that the mantle material brought up by kimberlites could aid them in their exploration thanks to a geochemist named John J. Gurney at the University of Capetown.  Diamonds form in equilibrium at specific temperatures and pressures with other minerals more abundant than diamonds.  Gurney, funded by Superior Oil, analyzed extensive mineral assemblages from kimberlites with and without diamonds and found that there are chemical signatures in the minerals that show up when diamonds are present.   One of the more famous diagrams is that of the chromium and calcium concentrations in garnets from the mineral assemblages.  Garnets fall into two groups on the diagram called G10 and G9 and virtually all garnets that occur with diamonds fall within the G10 field shown below.  As mentioned before, diamonds can reequilibrate in kimberlites and become graphite or evaporate away as carbon dioxide.  The diagram shows the line of stability under chromium saturation where diamonds will breakdown.  Some diamonds remain stable in the graphite field because the conditions do not last long enough to degrade the diamonds.  But if G10 garnets fall above the diamond-graphite equilibrium line it is a pretty sure bet you are on the right track for diamondiferous kimberlites.  And that is precisely what Fipke kept finding in in his samples of glacial debris as he flew along with Blusson (who not only has a PhD but is a pilot) periodically sampling them.  The long-gone glaciers were pointing the way.

garnetAfter Nowicki et al., 2007

At the time in the mid 1980s, geologist understood the relationships between these indicator minerals and diamonds, but how could the information be used to find the kimberlites in the Canadian craton?  What was unique about Fipke and his partner Blusson was the way they approached the problem.  They knew that the glaciers were powerful enough to gouge out the relatively soft kimberlite and carry the indicator minerals long distances destroying any signs of the kimberlites at the surface and subsequently burying them under debris carried by the glaciers when they melted.  They reasoned that they might be able to sample glacial deposits and “walk” the indicator minerals back to their source.  Standard Oil liked the idea and funded their exploration at first.  No one knew then that it would take eight years, millions of exploration dollars, and several companies before they hit pay dirt.  De Beer’s geologists also knew the answer was in the glacial remains, but to them it was a nine to five job and the season ended after 8 weeks of summer collecting.  For Fipke, it was a life’s dream, and nothing terminated his resolve collecting well into the cold months of the far north.

Fipke and Blusson focused on eskers (see the esker shown below) which are sinuous ridges of stratified sand and gravel deposited by water flowing in tunnels of ice within or under the glaciers.  As the glaciers recede the ridges remain like compasses indicative of the direction the water and ice once flowed.  If the glaciers rumbled over kimberlites, the proof would be in the streams that carried the glacial till away.   They kept going even after Standard Oil called it quits.  The G10 garnets kept telling them they were on the right road and the mining giant BHP believed them when they began running out of money.  Dia Met, the company Fipke and Blusson formed, signed a sweet deal with BHP.  BHP agreed to fund the exploration for a 51% stake.  Within six months after teaming with BHP, Fipke had come to a point where the G10 garnets disappeared near Lac de Gras.  Fipke knew he was close to the source.  As the story goes, he noticed a lake from the air that looked like it sat in a bowl-shaped depression near where the G10 garnets disappeared.  He had to have a sample of the rock in that depression.  They landed the plane on the lake, rowed to shore, and started to dig, but after many hours they were still in glacial till.  They decided to walk the shoreline for a better place to dig.  That is when Fipke’s son Mark, found a piece of kimberlite.  They were all ecstatic — the lake must sit on the pipe.  Gurney eventually analyzed the mineral assemblage and verified that it was highly likely to be a diamond-bearing kimberlite.  BHP quickly flew a geophysical survey which showed a distinct structure below the lake.

FulufjalleteskerEsker in Sweden (Hanna Lokrantz Wikipedia)

BHP and Dia Met started quietly staking as much land around the lake as they could.  Kimberlite pipes frequently occur in bundles so it was imperative that they obtain rights to as large a region as possible before word got out of the find.  While they were staking, BHP flew a drill rig in by helicopter and cored 455 feet under the lake pulling out beautiful samples of kimberlite 33 feet below the glacial debris with 80 plus small diamonds. Canadian law requires that companies announce to their shareholders when a potentially profitable body is found.  On November 12, 1991 they announced the results from the core including the fact that a few gem-quality diamonds had been recovered from the core.  All hell broke loose, and the rush was on by large and small companies alike to stake as close to BHP’s claims as possible in the hopes that other pipes might be buried nearby.   BHP would go on to discover more than 150 kimberlite pipes helping to make Canada the third largest producer of diamonds in the world.  De Beers even found a few mines.  Fipke and Blusson became billionaires overnight (if you don’t count the 8 years of exploration).

The image below shows the Etaki mine – one of the producing mines staked within Fipke’s original claims.   The large circular depressions in kmberlite represent part of the open-pit mining operations BHP is running.


Untitled-1 copy
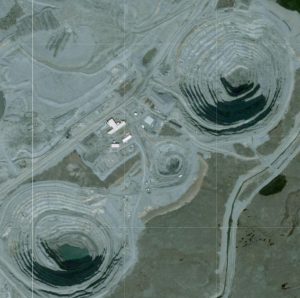
Ekati mines from the air (Google Maps)

  1. Shirey, S. B. and Richardson, S. H. (2011) Start of the Wilson Cycle at 3 Ga shown by diamonds from subcontinental mantle: Science 333, 434-436
  2. Pearson, D. G., Davies, G. R., Nixon, P. H., and Milledge, H. (1989) Graphitized diamonds from a peridotite massif in Morocco and implications for anomalous diamond occurrences: Nature, 338, 60-62
  3. Russell, J. K., Porritt, L. A., and Hilchie, L. (2013) Kimberlite: rapid ascent of lithospherically modified carbonatitic melts: In Pearson, D. G. et al, Proceedings of 10th International Kimberlite Conference Vol. 1 p. 195-210
  4. Nowicki, T. E., et al. (2007) Diamonds and associated heavy minerals in kimberlite: A review of key concepts and applications: Developments in Sedimentology, 58, 1235-1267
  5. Cross, L. D. (2011) Treasure Under the Tundra: Canada’s Arctic Diamonds: Heritage House Publishing Co

Last summer I attended the annual fourth of July parade in our local town with my family.  We enjoy watching the floats, pageantry (I am embellishing a bit here), and the copious quantities of candy thrown at us.  Nearly every local business has a float — well a truck with the company name on it serves as a float in many instances.  The local politicians, constabulary, high-school marching bands, queens of various vegetable festivals, local junior baseball teams, etc. join the queue.  The obligatory paper advertisements are handed out by the business participants lauding their merchandise.

During the parade, I had a paper shoved in my face about the problems with genetically modified organisms (GMOs).  I had just heard a wonderful Ted talk about how safe GMOs were by genetic scientist Pamela Ronald so the proclamation caught my attention.  I realized that the polemic was being passed out by a local health-food store.  There was an obvious conflict of interest – by creating suspicions that GMOs were unhealthy or even harmful the store benefited by encouraging people to buy the non GMOs they sold.  Disinformation to make a buck?  The World Health Organization, the United Nations Development Programme, National Academy of Sciences (US), American Medical Association, American Association for the Advancement of Science, Food and Drug Administration, American Cancer Society, and more than 270 other prestigious groups including many Academy of Sciences in other countries have gone on record through numerous reports that GMOs are safe.

I spent a bit of time in my last essay on global warming bemoaning how the subject has become a political hot potato because of disinformation by Exxon (and I mentioned other examples such as Big Tobacco, the National Football League with concussions, and creationists).  Was the radical left on a disinformation campaign also?  It certainly appears so.  As a scientist I know how difficult it is to achieve a consensus on a hypothesis.  Scientists have no time for unsupported opinions – they demand empirically supported results.  I don’t deny that politics plays a role, but I like to think, at the end of the day, that the accepted theories that make it through the labyrinth of scientific scrutiny are extremely sound.  Let’s not forget that scientists have egos and you get intellectual brownie points for debunking someone’s work.  It’s a jungle out there as I have discovered first hand as a research professor.  When I see the community of scientists fundamentally agreeing on a topic, I find it fairly convincing (scientists agreeing is an amazing thing in itself).  I don’t mean to imply that science cannot make mistakes – there are some notorious examples.  But I cannot think of a better way to make educated decisions – based on the research from the experts in the scientific community.  Unsupported opinions just don’t cut it even if the people are well meaning.

The case of Golden Rice demonstrates the horrendous impact anti-GMO groups can have in a rush to prevent GMOs from reaching the marketplace1.  According to Scientific American Golden Rice had passed the health and safety issues for commercial use by 2002.  Syngenta had genetically engineered Vitamin A from corn (beta-carotine) into rice.  Syngenta altruistically turned over all the monetary interests for the use of the rice to a non-profit organization to avoid any interference from anti-GMO groups that fight biotech companies for profiting on GMOs.  The only hurdle left was regulatory approval.  In 2015, Golden Rice was among seven products that won the Patents for Humanity award, but the rice is still not in use anywhere (The Golden Rice Now advocacy group tells me that the Philippines and Bangladesh are expected to have Golden Rice available in 12 months – some time in the middle of 2017).  Amazingly, the life-saving rice is strenuously opposed by environmental and anti-globalization activists who object to GMOs.

!1280px-Golden_RiceInternational Rice Research Institute (IRRI)

In 2014, Justus Wesseler of the Technische Universität München and David Zilberman of the University of California quantified the economic impact caused by the resistance2.  They estimate that at least $199 million dollars were lost per year over the previous decade just in India.  They likened the loss to a metric called life years which they calculated to be 1.4 million in India alone which reflects deaths, blindness and related health disabilities from not having access to Vitamin A.  Unfortunately children are the hardest hit.

I want to emphasize that the Golden Rice case is more than a battle over perceived danger by the anti-GMO movement in the face of contrary scientific evidence.  There are people dying while Greenpeace, the Sierra Club, and other misguided organizations wage war over unclear principles and leftists ideals.  And of course there is always the Non-GMO Project which was created by health-food retailers to sow seeds of doubt (I don’t know if the pun was intended or not) “who oppose a technology that just happens to threaten their profits” according to Scientific American.  I should make it clear that my criticism of Greenpeace and the Sierra Club is not done lightly.  They serve a real purpose in helping to preserve our environment.  But when the science argues against them and lives are at stake, we need to bring them to task.  Let me dive into the science that argues against radical and mindless battles over GMOs.

The National Academy of Sciences has just released a consensus 407-page report entitled Genetically Engineered Crops: Experiences and Prospects which reviewed decades of research on genetically engineered (GE) crops.  Their conclusions find that GE crops are economically beneficial, safe for humans and livestock, and have adequate regulation.  The data is overwhelming impressive and I will take the time to summarize some of the major points.

Humans have been modifying crops for 10,000 years.  A good example is the domestication of maize in Meso-America.  Teosinite, shown in the left of the diagram below, is a grass that went through a series of human selections of rare mutations to develop modern-day maize grown throughout the world (shown in the right part of the diagram).  The point is that humans have been modifying crops through selection of beneficial traits for millennia.

cornNAS

In 1985, the United States was the first country to approve a GE crop, and by 1994 a GE tomato, which delayed ripening, was produced for sale.  Through 2015 about 12 percent of the land available for crop production contains GE crops (the number goes to 50% in the US).  The figure below shows which GE crops are currently being produced and where.  Europe, Russia, and most of Africa have been particularly resistant to GE crops as you can see from the map.

gmoNAS

There are three major types of GE crops: 1) Herbicide resistant traits which allow the crop to survive herbicide application to kill weeds or insects.  2) Insect resistant traits which typically incorporate a gene code from Bacillum thuringiensis (Bt) to the crop, killing insects when they feed on the plant.  3) Virus resistant traits which keep the plants from being susceptible to specific plant viruses.  It is important to note that most of the crops are modified to resist one insect, virus, or herbicide.  Drought tolerance, nonbrowning (e.g., with potatoes and apples), various colors in flowers, stability of oil to suppress trans-fats, enhancement of omega-3 fatty acids are other examples of GE traits in commercial production.

The NAS report reviews studies conducted comparing the production of  GE crops to non-GE crops in mind-numbing detail.  But some clear important conclusions have been summarized below (I quote to avoid any misrepresentation of the information).  Please note that I have not included all the findings because many are quite esoteric.  I refer the reader to the NAS report for more details.

  1. “Although results are variable, Bt traits available in commercial crops from introduction in 1996 to 2015 have in many locations contributed to a statistically significant reduction in the gap between actual yield and potential yield when targeted insect pests caused substantial damage to non-GE varieties and synthetic chemicals did not provide practical control.”  Potential yield is the theoretical yield a crop could achieve if water and other nutrients are in adequate supply and there are no losses to pests and disease.
  2. “In areas of the United States where adoption of Bt maize or Bt cotton is high, there is statistical evidence that insect-pest populations are reduced regionally, and the reductions benefit both adopters and nonadopters of Bt crops.”
  3. “In all cases examined, use of Bt crop varieties reduced application of synthetic insecticides in those fields. In some cases, the use of Bt crop varieties has also been associated with reduced use of insecticides in fields with non-Bt varieties of the crop and other crops.”
  4. “The widespread deployment of crops with Bt toxins has decreased some insect-pest populations to the point where it is economically realistic to increase plantings of crop varieties without a Bt toxin that targets these pests. Planting varieties without Bt under those circumstances would delay evolution of resistance further.”
  5. “Planting of Bt varieties of crops tends to result in higher insect biodiversity than planting of similar varieties without the Bt trait that are treated with synthetic insecticides.”
  6. “Although gene flow has occurred, no examples have demonstrated an adverse environmental effect of gene flow from a GE crop to a wild, related plant species.”
  7. “Crop plants naturally produce an array of chemicals that protect against herbivores and pathogens. Some of these chemicals can be toxic to humans when consumed in large amounts.” I emphasized naturally here because the statement pertains to the production of chemicals by non-GE crops.
  8. “Conventional breeding and genetic engineering can cause unintended changes in the presence and concentrations of secondary metabolites.”  This is not only important but emphasizes the need for oversight in the approval of GE crops.  However, NAS also concluded: “U.S. regulatory assessment of GE herbicide-resistant crops is conducted by USDA, and by
    FDA when the crop can be consumed, while the herbicides are assessed by EPA when there are new potential exposures.”
  9. Regarding safety, NAS concluded: “In addition to experimental data, long-term data on the health and feed-conversion efficiency of livestock that span a period before and after introduction of GE crops show no adverse effects on these measures associated with introduction of GE feed. Such data test for correlations that are relevant to assessment of human health effects, but they do not examine cause and effect.”  In others words, GE crops appear to be safe for the animals that consume them and for humans that consume either these animals or the GE crops directly.
  10. “The incidence of a variety of cancer types in the United States has changed over time, but the changes do not appear to be associated with the switch to consumption of GE foods. Furthermore, patterns of change in cancer incidence in the United States are generally similar to those in the United Kingdom and Europe, where diets contain much lower amounts of food derived from GE crops. The data do not support the assertion that cancer rates have increased because of consumption of products of GE crops.”
  11. “The committee found no published evidence to support the hypothesis that the consumption of GE goods has caused higher U.S. rates of obesity or type II diabetes.”
  12. “The committee could find no published evidence supporting the hypothesis that GE foods generate unique gene or protein fragments that would affect the body.”
  13. “The committee did not find a relationship between consumption of GE foods and the increase in prevalence of food allergies.”
  14. “The similarity in patterns of increase in autism spectrum disorder in children in the United States, where GE foods are commonly eaten, and the United Kingdom, where GE foods are rarely eaten, does not support the hypothesis of a link between eating GE foods and prevalence of autism spectrum disorder.”
  15. “On the basis of its understanding of the process required for horizontal gene transfer from plants to animals and data on GE organisms, the committee concludes that horizontal gene transfer from GE crops or conventional crops to humans does not pose a substantial health risk.”
  16. “The available evidence indicates that GE soybean, cotton, and maize have generally had favorable outcomes in economic returns to producers who have adopted these crops, but there is high heterogeneity in outcomes.”
  17. “Exploitation of inherent biological processes—DNA binding-zinc finger proteins (ZFNs), pathogen-directed transcription of host genes (TALEs), and targeted degradation of DNA sequences (CRISPR/Cas)—now permit precise and versatile manipulation of DNA in plants.”
  18. “New molecular tools are further blurring the distinction between genetic modifications made with conventional breeding and those made with genetic engineering.”
  19. “Treating genetic engineering and conventional breeding as competing approaches is a false dichotomy; more progress in crop improvement could be brought about by using both conventional breeding and genetic engineering than by using either alone.”
  20. “In some cases, genetic engineering is the only avenue for creating a particular trait. That should not undervalue the importance of conventional breeding in cases in which sufficient genetic variation is present in existing germplasm collections, especially when a trait is controlled by many genes.”
  21. “Although genome editing is a new technique and its regulatory status was unclear at the time the committee was writing this report, the committee expects that its potential use in crop improvement in the coming decades will be substantial.”  I think this is an extremely important conclusion.  If we want to continue to feed the world we are probably going to become more dependent on GE crops particularly if population continues to increase at present rates.
  22. “Genetic engineering can be used to develop crop resistance to plant pathogens with potential to reduce losses for farmers in both developed and developing countries.”
  23. “Genetic engineering can enhance the ability to increase the nutritional quality and decrease antinutrients of crop plants.”
  1. There are similar accounts of environmental groups shutting down a genetically modified eggplant in India, Bangladesh, and the Philippines.  Another involved a genetically modified potato which was resistant to specific herbicides.  A large food chain under pressure from environmental groups refused to purchase genetically modified potatoes and the project was shut down.  Farmers then introduced a new herbicide for the non-genetically modified potatoes grown instead
  2. Wesseler, J. and Zilberman, D. (2014) The economic power of the Golden Rice opposition: Environmental and Development Economics: 19, 724-742